

Gas was the second largest source of UK electricity generation in 2024, providing 26.3% of our electricity.1 Having analysed offshore wind power in some detail, I am turning my attention to gas power stations.
I am trying to analyse energy in the UK to help improve policy. None of the content should be construed as investment advice. I have done my best to ensure that the content below is accurate – but I am human and will make mistakes – if you spot any, please let me know and I shall update as appropriate.
How do we generate electricity from natural gas?
In simple terms, we need to transform the chemical energy within natural gas into electrical energy. This is done using a gas turbine that is attached to a generator.
The word ‘gas’ will be used frequently throughout this post - as a point of clarification, I will use ‘natural gas’ when referring to a fuel source, and ‘gas turbine’ when referring to the technology used to power an aircraft or power station.
Starting with a jet engine…
Its easiest to start the explanation with a jet engine, as it was from the 1930’s that the potential of gas turbines started to emerge, initially in military aircraft, then beginning to enter service in civilian aircraft from the early 1950’s, with the de Havilland Comet.
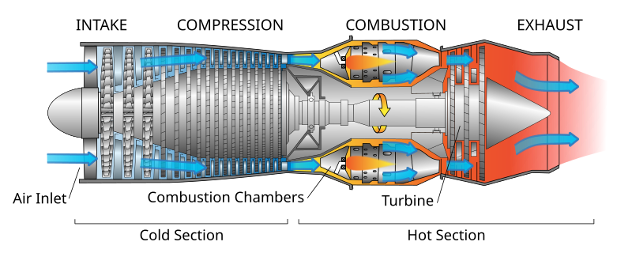
There are four key stages/parts that I will try and explain with the help of the diagram below – these are compression, combustion, the turbine and the exhaust.
Compression: Air enters via an intake and is then compressed by a series of fan blades, powered by a central spinning shaft.
Combustion: The compressed air enters a combustion chamber, where it is mixed with fuel and combusted, generating a mix of hot gases. Due to the rising temperature, these gases expand.
Turbine: The expanded mix of hot gases are then forced over a series of turbine blades. The turbine blades capture some of the kinetic energy of the combusted gases, rotate, and are attached to the central spinning shaft that powered the compressor from stage 1.
Exhaust: The energy that isn’t captured by the turbine blades (and used to power the compressor) passes through the exhaust, generating thrust for the plane.
To power a plane, you would ideally want an engine that was light relative to its power, and maximised the thrust out of the exhaust, capturing only as much via the turbine as is required to power the compressor.
Some of the properties of the jet engine made it useful for backup power provision on the electricity grid – a relatively small, powerful engine, that could also be ramped up and down quickly.
Getting electrical output instead of lots of thrust meant attaching a generator to the spinning central shaft that was powered by the turbine.
An early example of gas turbine installation into the UK electricity system was an upgrade to Greenwich Power Station. Whilst the station was originally built in the early 20th Century to power London’s tram system, in 1968-72, the original coal powered boilers were replaced by gas turbines, to help provide backup and peak power for the tube network.2

Gas turbines for the electricity market
Over time, turbine manufacturers increasingly focussed on building gas turbines specifically for the electricity market. The weight of the turbine no longer became a constraint (as it wasn’t airborne) and manufacturers could work towards increasing the efficiency of converting fuel into electrical output.
In practical terms, this meant they wanted less energy output (waste) via the exhaust, and a greater proportion captured by the turbines, increasing the energy available via the rotary shaft to be converted to electrical energy by the generator. In short, more spinning and less exhausting.
A gas turbine used to generate electricity that doesn’t capture useful energy from the hot exhaust gases is referred to as an Open Cycle Gas Turbine or OCTG. Efficiencies of the largest open cycle gas turbines are around 38-42%, according to Paul Breeze, the author of “Power Generation Technologies”3
However, further efficiency improvements can be made, if you can harvest some of the energy in the exhaust gases. This is done by using a steam turbine to convert the previously wasted heat into kinetic and ultimately electrical energy. This is referred to as a Combined Cycle Gas Turbine or CCGT, with the best plants delivering a combined efficiency around the 60% mark.4
Rather than subject you to more text and diagram-based descriptions, this Youtube video explains how gas turbines work, and from 2 minutes onwards, it explains the combined cycle process.
UK: Gas emergence on the national grid
I think it’s helpful to show where the gas power plants are situated in the UK. The image below shows the location of major power generation assets as of May 2024. I apologise to any Shetlanders – I have removed the Shetland Islands to help reduce the height of the image. Gas power stations are the large orange blobs.
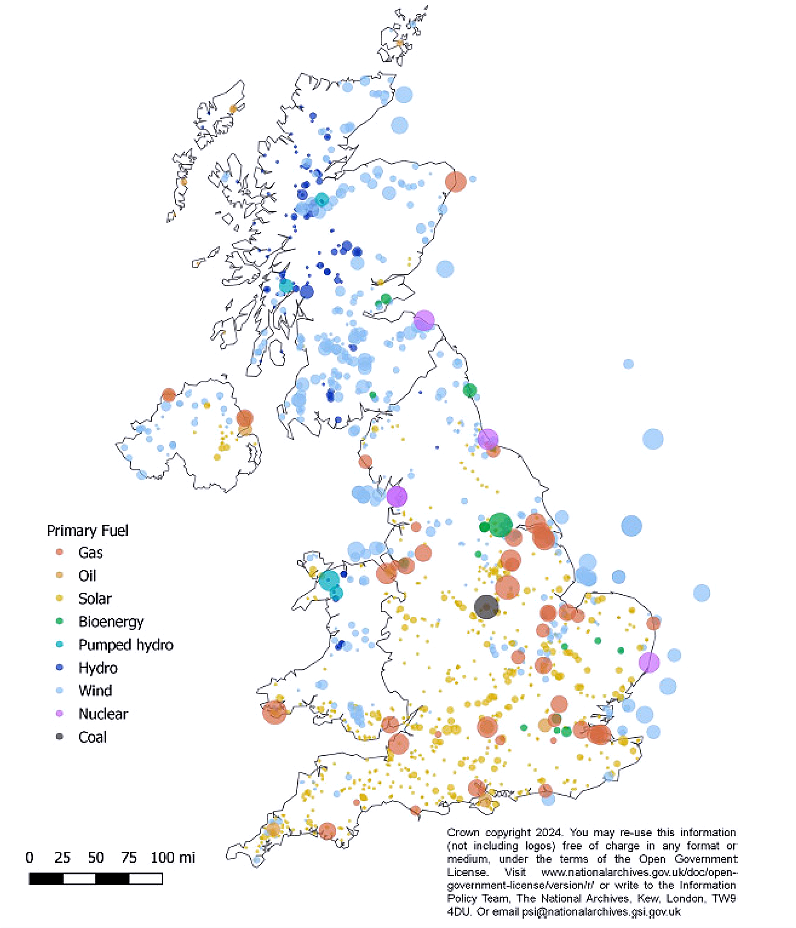
Its notable that the gas power plants (with some exceptions) are concentrated in the southern half of the UK, with most of them south of Leeds.
The Department for Energy Security and Net Zero also published an article in 2024 that gave an illustration of UK power plant locations through time. I have stitched together their maps for 1960, 1980, 2000 and 2023.
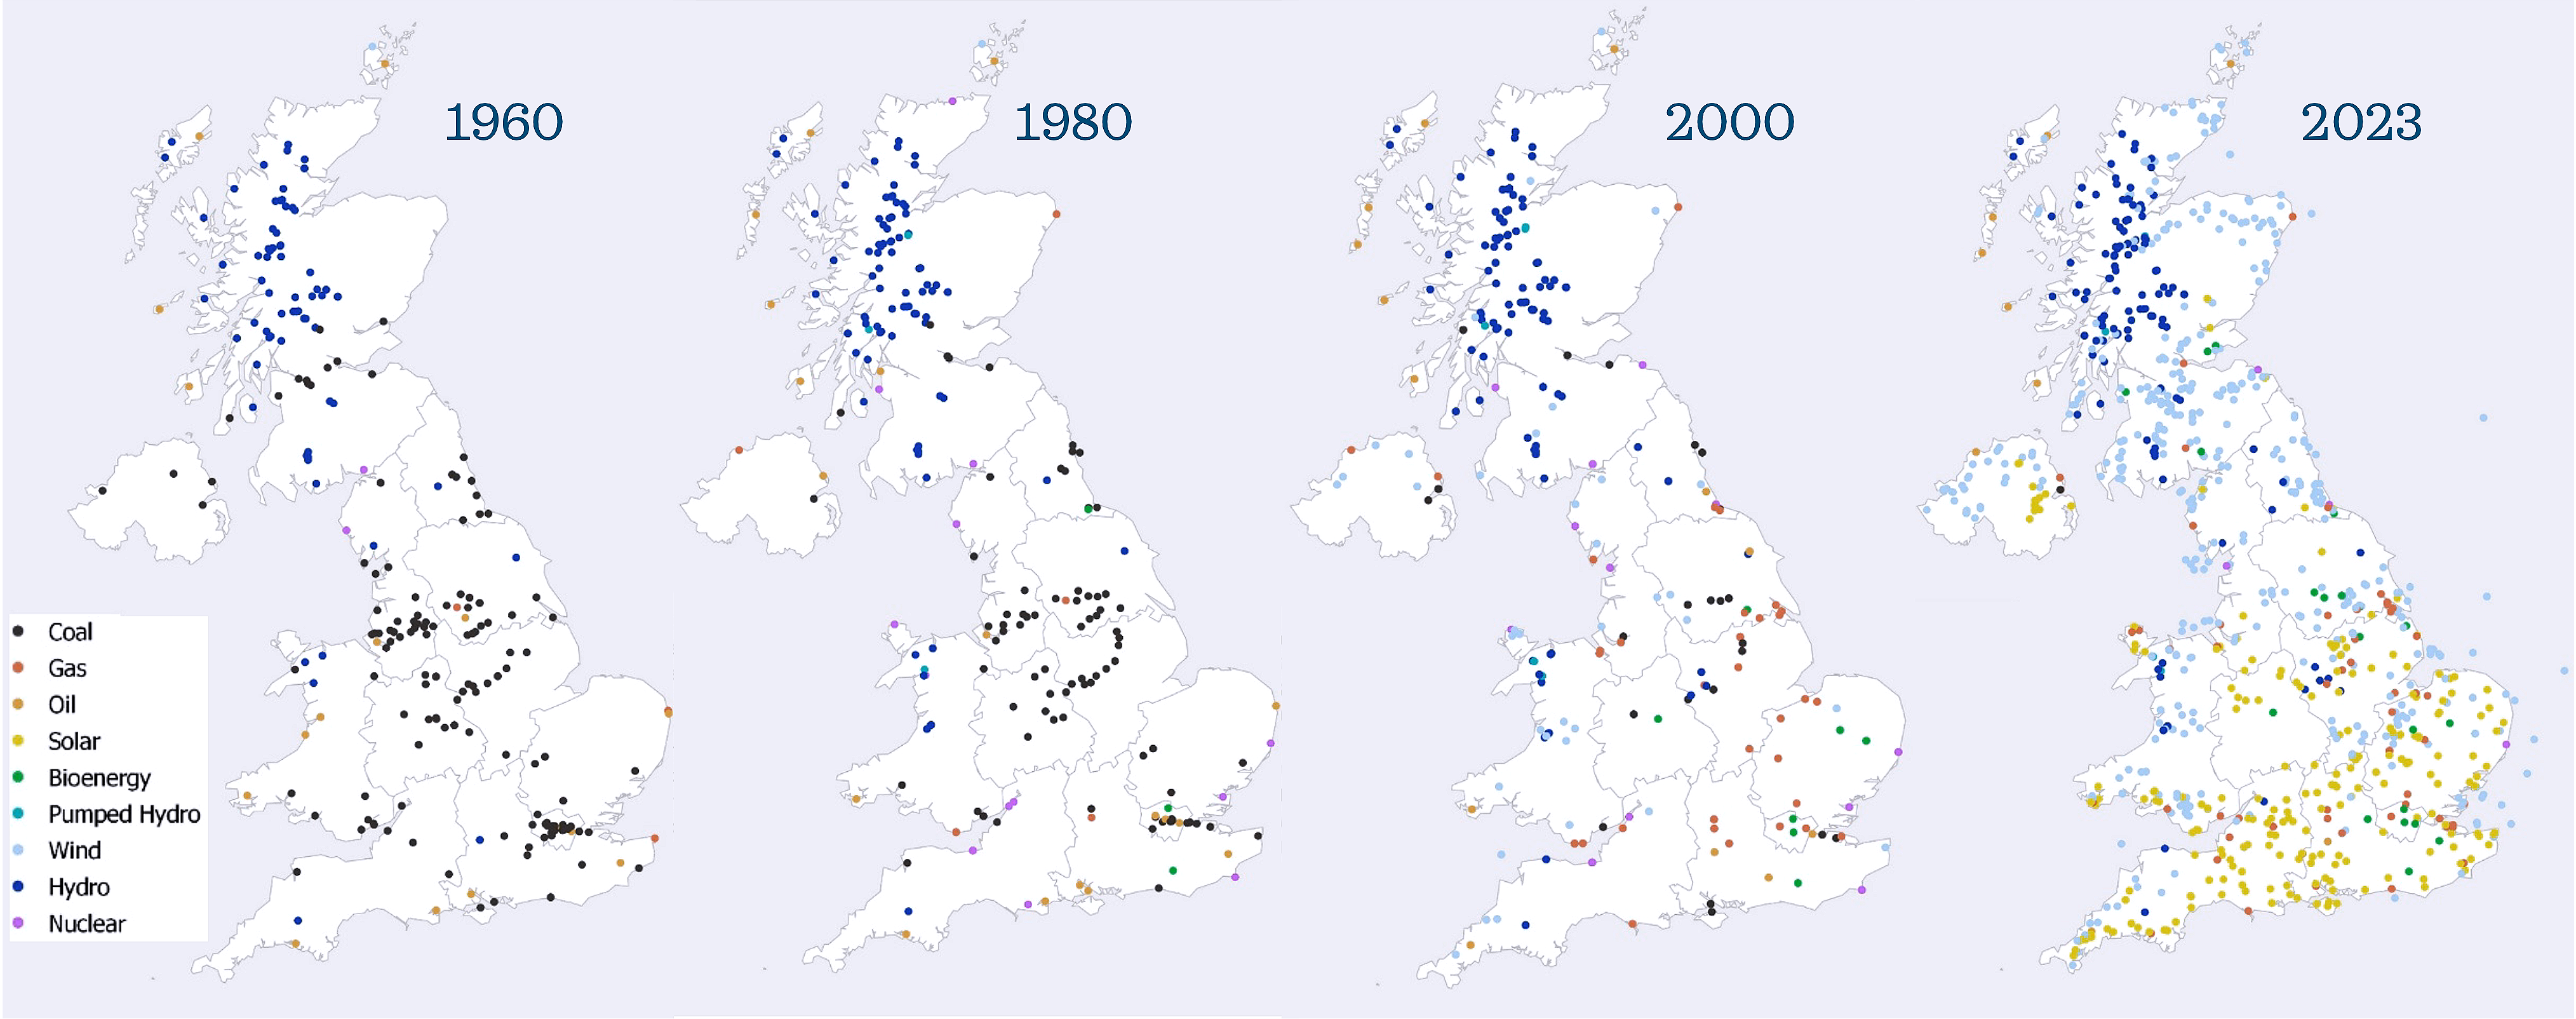
You might have to click into the image to make it decipherable, but a few key trends stand out for me:
The increased prevalence of gas power stations in 2000 vs 1980
The reduction in the number of coal power stations through time
The move away from city based electricity generation - note the clusters of coal power stations around London, Liverpool and Manchester in 1960
The huge increase in the number of generators (solar and wind based) from 2000 to 2023 - perhaps the subject of a future post
The Dash for Gas
There are a few key reasons for the increased number of gas power stations in the 2000 map compared to 1980:
North Sea gas came online, roughly tripling UK natural gas production between 1980 and 2000.5
Development of Combined Cycle Gas Turbine technology enabled higher efficiency.
Privatisation of UK electricity markets - gas plants had lower capital costs than coal/nuclear during a period of high interest rates.
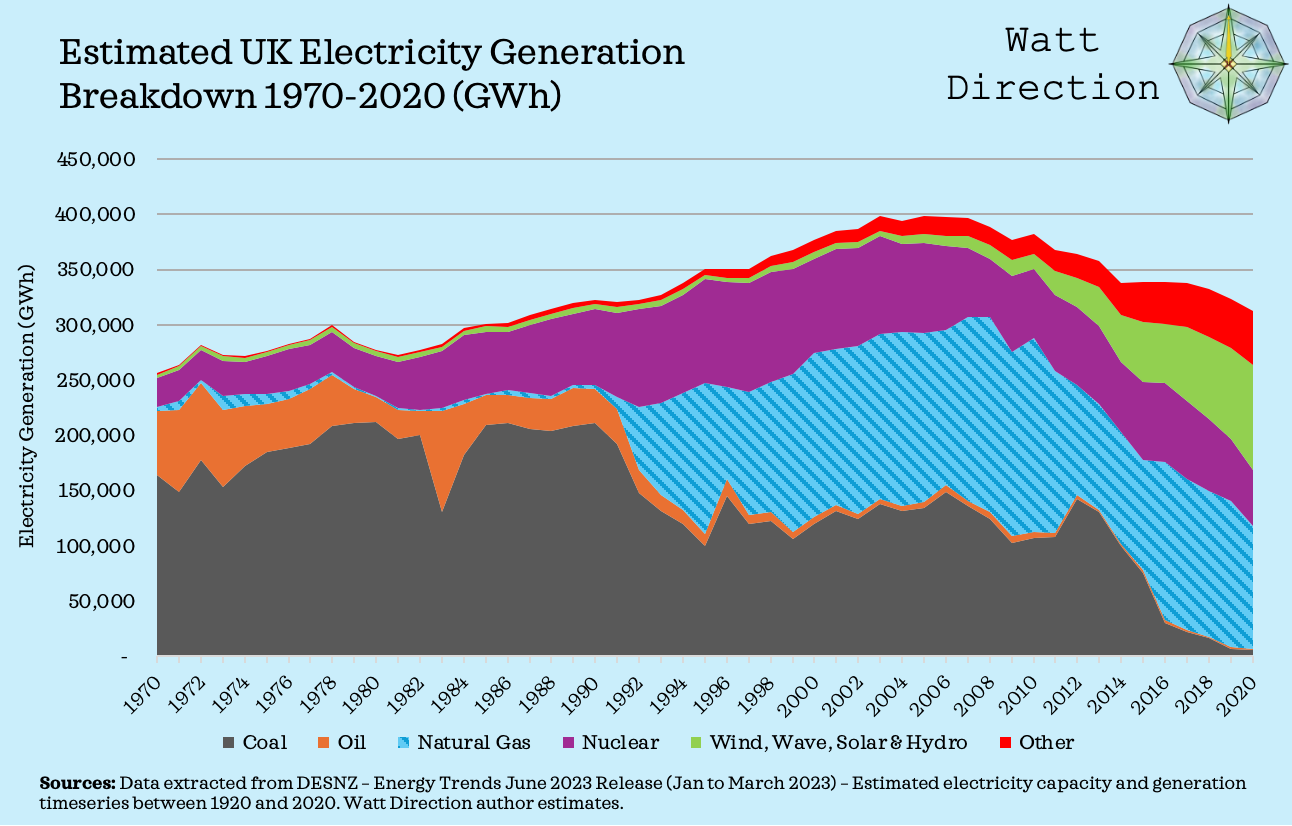
My final graph breaks out the percentage of UK electricity generation from gas over time. The gas power station buildout was exceptionally fast, shifting from c. 1% of the UK generation mix in 1989 to c. 39% by the year 2000.6
Thanks very much for reading - I’m hoping to produce some work on the economics of gas power plants over the next couple of months. Please feel free to share/subscribe if you find my work interesting, and all feedback is appreciated.
https://www.neso.energy/news/britains-electricity-explained-2024-review
https://www.bbc.co.uk/news/uk-england-london-30724691
Page 80, Breeze, P. (2019) Power Generation Technologies, Third Edition. Kidlington, Oxford, United Kingdom: Newnes, an imprint of Elsevier.
Page 71, Breeze, P. (2019) Power Generation Technologies, Third Edition. Kidlington, Oxford, United Kingdom: Newnes, an imprint of Elsevier.
https://www.gov.uk/government/statistical-data-sets/historical-gas-data-gas-production-and-consumption-and-fuel-input
DESNZ – Energy Trends June 2023 Release (Jan to March 2023) – Estimated electricity capacity and generation timeseries between 1920 and 2020.