


Removing the Ampersand in Oil & Gas
An essay on pragmatism in the UK North Sea


N.B. - this was first posted on the 10th of February 2025. Thanks to reader feedback, I have edited the original content to better explain the complexities of the UK oil supply chain. Details of the changes will be logged in the appendix.
My first post on Watt Direction included three principles with respect to the UK and its relationship with energy. Without specifying a weighting, I cared about:
Decarbonisation and air quality
Prosperity
Energy security and reliability
For this piece, I am adding a constraint of “political feasibility” defined as what I think could reasonably be achieved by the current UK government, which has a sizeable parliamentary majority and is likely to be in power for at least the next four years.
I am trying to analyse energy in the UK to help improve policy. None of the content should be construed as investment advice. I have done my best to ensure that the content below is accurate – but I am human and will make mistakes – if you spot any, please let me know and I shall update as appropriate.
I make the case that the UK should have differentiated policy for “oil” and “gas” within the North Sea.
I believe there are compelling carbon, security and prosperity reasons for doing so and that it would be politically feasible (although not easy) for the current administration to make this change.
The key headings and summary of my argument are below:
Brief explanation of current tax rates and politics in the North Sea
Explanation of gas and oil supply chains
Carbon: Imported liquefied natural gas is higher carbon than domestic production
Demand: Reducing gas use is no easier than reducing oil use
Feasibility: 3 proposals
Political positives and drawbacks
Current tax rates and politics in the North Sea
If anyone wants the a more complete taxation history, “Taxation of North Sea oil and gas” from the House of Commons Library is a good resource.1
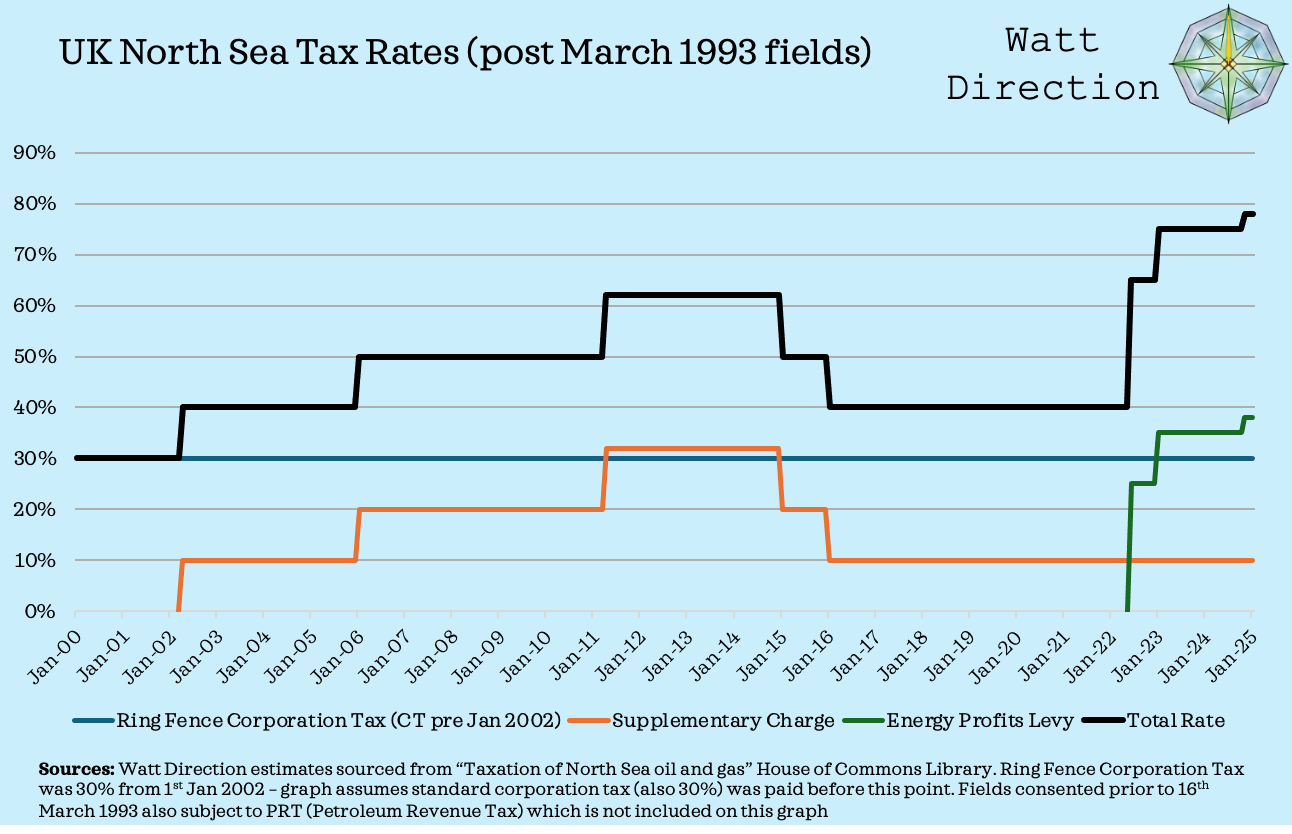
Currently the headline rate of tax is 78%. This is composed of:
Petroleum Revenue Tax (PRT) currently 0% - a historic charge for fields consented pre-16th March 1993. Based on oil and gas profits at an individual field level as opposed to a corporate level. Reduced to 0% from Jan 2016 so of limited relevance.
Ring Fence Corporation Tax (RFCT) – currently 30% - similar to standard corporation tax but at a higher rate and with a ring fence that provides capital allowances. Also has some restrictions on the deductibility of interest and losses elsewhere.
Supplementary Charge (SC) – currently 10% - another charge on ring fence profits but with no interest deduction.
Energy Profits Levy (EPL) – currently 38%. Introduced at a 25% rate in 2022, associated with the energy price spikes around the Russian invasion of Ukraine, subsequently increased.
I have broken out what I estimate to be the combined tax rate for post 1993 oil and gas fields in the graph below (i.e. those not subject to the PRT) The graph does not make any adjustments for changes to capital allowances over time.
A final point is that the EPL is due to end in March 2030 (but some scepticism is warranted given that this has been extended in the past) It also has the potential to end early if the 6 month average of BOTH oil and gas prices falls below a certain level (Currently $74.21 for oil and 57p per therm for gas)2
Rules & Politics:
Page 52 of the Labour manifesto for the 2024 election makes a series of points:3
Labour will not revoke existing licenses
Labour will partner with business and workers to manage existing fields for the entirety of their lifespan
Labour will not issue new licenses to explore new fields
The third point doesn’t necessarily mean an end to all incremental development activity. Firstly, there are previously licensed fields that could still be developed, and secondly, operators are still able to develop their existing fields (e.g. by drilling infill wells)
Another factor is the legal interpretation of government policy. For example, on the 30th of January 2025, a Scottish court ruled that the Rosebank oil field and Jackdaw gas field had been approved unlawfully and would require fresh approval to begin production.4 This followed a Supreme Court ruling in June 2024 that blocked an onshore oil drilling project in Surrey.5
The North Sea Transition Authority (NSTA) is the regulator in charge of exploration and development. It also has responsibilities to reduce emissions (e.g. via electrifying oil and gas infrastructure and reducing flaring)
Security and Self-Sufficiency:
The Department for Energy Security and Net Zero (DESNZ) publish incredibly helpful data, and a particular highlight is their “Energy Trends” publication, which is issued quarterly. One of the data sets within it compares domestic production to total demand for a variety of different fuels. I have pulled together charts for petroleum products (oil and its derivatives) and for natural gas to compare how much we produce domestically vs. our total demand.
The natural gas supply chain is relatively simple. The UK produces some gas, imports some via pipeline and liquified natural gas (LNG) and also exports a little.

I think its reasonable to think in terms like “security” and “self-sufficiency” for gas, as UK produced gas will largely be used domestically, perhaps with some exports during the summer months.
The UK was a net exporter of natural gas as recently as 2003. There was then a rapid production decline from 2004 to 2012, with the UK averaging around 52% self-sufficiency for the decade up to 2023.

The oil and petroleum product supply chain is much more complicated. The UK produces some primary oil, but exports about 80% of this to refineries abroad that are better equipped to deal with our relatively sour (or high sulphur content) crude oil. Ed Conway wrote an excellent explainer that can be found below:

The UK then imports lower sulphur primary oil that is better suited to its domestic refineries, that were largely built before North Sea production came online. The oil is then refined into petroleum products (e.g. petrol, diesel, aviation fuel) and some is exported, with other products imported. In 2023, the UK was a net exporter of petrol, but a net importer of diesel and aviation fuel.6 I have added a simplified chart of the supply chain below.

I don’t think the concept of “self-sufficiency” or “security” applies as strongly with respect to domestic oil production and its derivative petroleum products. Its hard to argue that increasing domestic oil production makes you less reliant on the physical integrity of global supply chains when c. 80% of it is exported to refineries overseas.
However I think there is space for the concept of “fiscal security”.
Imagine an extreme case where the UK has zero domestic primary oil production or refinery capacity, but still uses a substantial amount of refined products. In an environment of low oil prices and low refinery margins, this isn’t much of a problem.
However, if the oil price tripled and refinery margins rose, UK businesses and consumers would be hit with cost pressures, likely leading to an economic slowdown.
In an alternate reality, where the UK had some domestic oil production and refinery capacity, the UK government would at least get some offsetting tax revenues - currently at 78% of oil and gas production profits and 25% of refinery profits through standard corporation tax. Thus even if consumers and businesses are still impacted by higher prices, at least the state gets some counter cyclical tax revenues.
I have added a graph comparing domestic primary oil production, domestic refined product production and refined product demand.
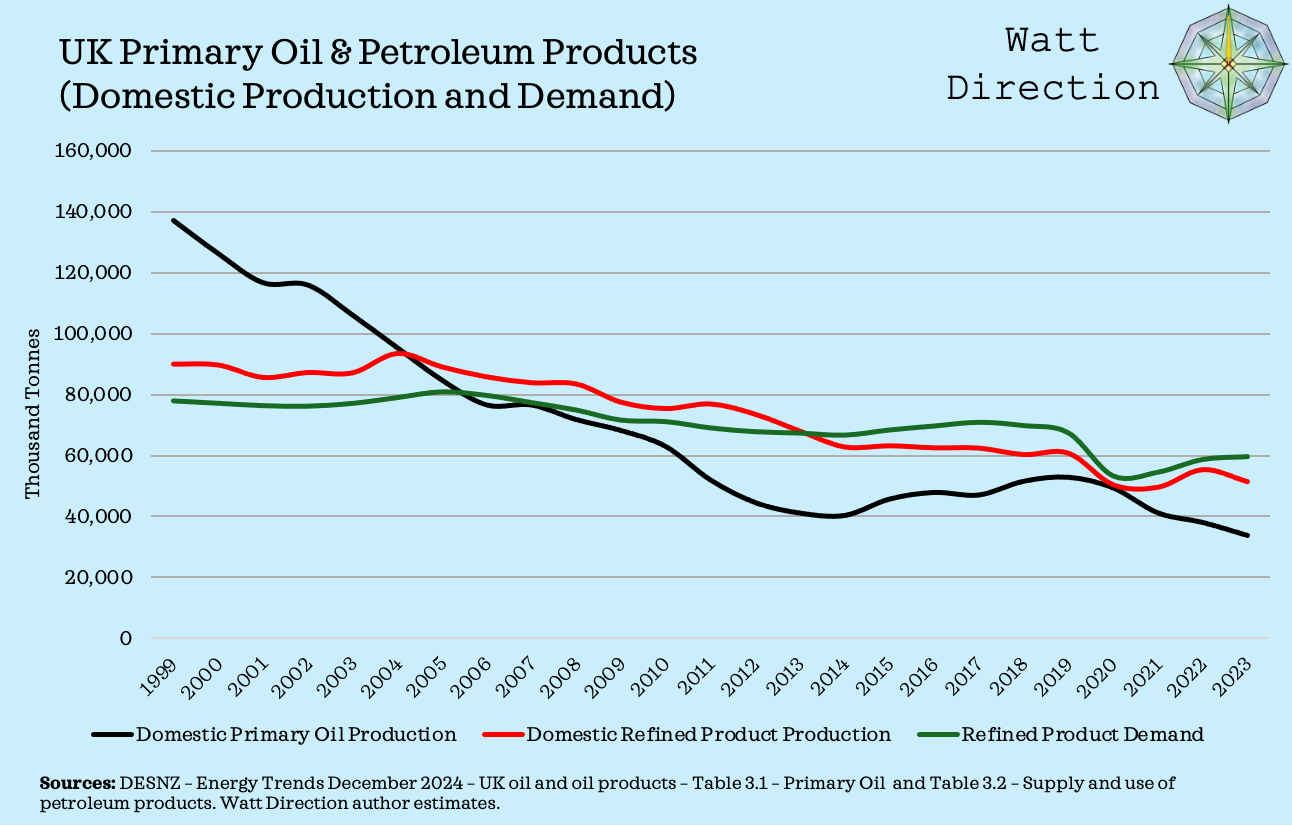
I think the main trend to draw out is that the green line (refined product demand) has fallen much more slowly than either primary oil production or refined product production.
I will add a final chart that compares the amount of primary oil production to the amount of refined product demand, but must stress that this only captures a sense of “fiscal security” as the atoms in oil from domestic production are largely not those that might end up in your fuel tank!

Carbon: Liquified Natural Gas (LNG)
Broadly speaking, there are four major ways of moving large quantities of oil or gas – pipeline, boat, rail and truck.
Being an island, with de-minimis land-based production, the UK has a choice of pipeline or boat. Sourcing hydrocarbons close to the UK should in theory have an energetic and thus a carbon saving versus shipping it from thousands of miles away.
The ever helpful “Sustainable Energy – Without the Hot Air” provided some numbers with respect to oil. On page 95, Sir David MacKay calculated that an oil tanker would use about 1% of the energetic value in its oil to move 10,000km.7 To sense check, I found a ship selling website, suggesting that Aframax tankers with a deadweight of 80,000 to 120,000 tonnes typically used 50 tonnes of fuel per day at 15-16 knots.8 50 tonnes represents c. 0.05% of carried fuel per day and 15.5 knots is about 28.7 km/h. Thus 10,000 km should take about 348 hours, 14.5 days or 0.73% of the ships fuel capacity.
10,000 km is approximately ¼ of the circumference of the earth. Even if moving oil by pipeline had zero energetic losses, the relative advantage over shipping cannot be very significant.
Transporting natural gas by boat is a very different kettle of fish. Natural gas is primarily composed of methane, which is a gas at room temperature and has a boiling point of -161.5 °C. To make transport by boat economically plausible, natural gas must be in a denser, liquified form – hence Liquified Natural Gas or LNG. The LNG basics page from the US Department of Energy informs me that once LNG is cooled to about -162°C, its volume reduces to 1/600th of its gaseous state.9
The process for US gas moving to the UK would look something like the following:
Gas extracted from shale rock via fracing
Moved in gaseous form via pipeline to the coast
Purification to remove compounds that might freeze during cooling
Liquified via cooling to -162 °C
Shipped over the Atlantic via an LNG tanker
Regasification in a UK port facility
Moved to end user, most likely via pipeline
The requirement for purification, liquefaction and regasification feels like an energy intensive process. Luckily I can use some third party data rather than relying on my own intuition.
The North Sea Transition Authority (NSTA) published a carbon footprint analysis for the production emissions of UK North Sea gas vs imported LNG using 2022 data.10 Amusingly, UK domestic gas is not actually the winner, with Norwegian production via pipeline the lowest of the sources.
I have added the production carbon intensity from the NSTA to a combustion carbon equivalent figure of 320kg/CO2e per barrel of oil equivalent (BOE) from the IEA.11

It might not be a huge difference, but UK domestic production on this measure is about 14% less carbon intensive than imported LNG.
As a sense check, I also found a 2013 document from the Department of Energy and Climate Change (written by Professor David MacKay and Dr Timothy Stone) that examined the potential greenhouse gas emissions associated with UK shale gas.
Whilst UK shale isn’t relevant to this argument, there are helpful comparative graphs on the emissions intensity of different gas sources. Their range of CO2 equivalent per kWh of chemical energy is 199-207g for conventional gas and 233-270g for Liquified Natural Gas.12 Taking the midpoint of each estimate, the emissions associated with conventional gas are c. 19% lower than LNG.
I am sure that these differences could be reduced, via greater electrification of the liquefaction process, and potential energy recovery at regasification facilities, but it does appear that imported LNG is appreciably more carbon intensive than domestic gas.
I may be wrong, but I don’t think that the carbon difference associated with transport is as great for crude oil, as it remains a liquid throughout. Moreover, if UK primary oil is largely exported, then there isn’t the same carbon based advantage from domestic production.
More North Sea Gas = Lower Emissions?
I am prepared to argue that the UK could have a small net reduction in carbon emissions by increasing its domestic gas production to the point that LNG imports became unnecessary. (Assuming that this didn’t lead to a rise in overall consumption) We can approximate what that level might be:

The graph above shows the total gas supply to the UK, split into domestic production, non-LNG imports, LNG imports and exports. The 2022/23 export data is a little spiky, as I believe that when Russian gas pipelines were cut off, the UK used its LNG import facilities to increase its LNG imports and re-export gas to Europe.
Putting that to one side, I will use assume the UK retained its 2023 net gas demand level of c. 700,000 GWh.
Non-LNG imports are mostly Norway and had the lowest emissions according to the NSTA, so if we could keep that anywhere around the 5-year average of c. 320,000 GWh that would be good. Ideally, you would then have 380,000 GWh of domestic production, which aligns with the c. 383,000 GWh produced in 2023. In other words, the UK should try and keep domestic production stable vs. its 2023 levels.
Unfortunately this is not happening - I only have data for the first three quarters of 2024, but Q1 - Q3 production is 13% below the same period in 2023.13
Demand:
A clear flaw in my argument might be that 700,000 GWh of gas p.a. is too high an assumption for a rapidly decarbonising/de-industrialising economy. In this section I will run through some back of the envelope calculations on what might happen to demand due to electrification efforts.
I have included two graphs below to show the long run history of usage patterns for both petroleum products and natural gas. However, the table after the two graphs is arguably of greater relevance.


The table is my best effort to split out the UK end uses of petroleum products and natural gas for 2023 in greater detail. I have highlighted in blue, areas that are both sizeable and where we have well understood decarbonisation pathways.

On the petroleum side, we have passenger cars and light goods vehicles (LGVs) weighing in at around 43% of the total. For natural gas, we have domestic use (mainly heating) and electricity generation, which combine to 63% of the total.
I’m going to take a 20-year view and try to be optimistic with my back of the envelope calculations. Electricity production aside, in each case I’m focussing on the installed base - or the existing fleet of cars, vans and gas boilers. Any incremental capacity growth is assumed to be all electrified or offset by efficiency gains.
Road Passenger (36% of petroleum product use) Electric Vehicle (EV) and Plug-In-Hybrid (PHEV) penetration of new car sales hit 28% in 2024, from 24% in 2023.14 I assume that the government ban on new combustion engine vehicles from 2035 happens. On my numbers, EV/PHEV sales work their way up by 5 percentage points p.a. to 78% of new sales by 2034 and then 100% from 2035-2045. I end up with a c. 80% EV/PHEV fleet by 2045.
Road LGV or Light Goods Vehicles (7% of petroleum product use) EV/PHEV penetration of new LGV sales was way lower at 6.3% in 2024 and hasn’t shifted much for three years.15 I assume the government gets tough from 2035 and we hit a 70% EV/PHEV fleet by 2045.
Domestic Gas (34% of gas use) Cooking is a rounding error; its mainly the 23 million UK gas boilers we need to think about.16 It’s hard to get good data, but I found some indications around 1.5m replacement boilers p.a. once I made some rough adjustments for new home sales. This implies a 15-year boiler life which sounds plausible. Heat pumps have barely made a dent – the current installed base in homes seems to be somewhere around 250,000 (c. 1%). DESNZ track government supported heat pump installations, which are at a run rate of c. 40,000 for 2024, up from c. 28,000 in 2022 and 2023.17 Given the grant in the Boiler Upgrade Scheme is £7500, I imagine this should capture most domestic upgrades. I found another source suggesting the sale of around 84,000 ground and air source heat pumps in 2024, but this will likely include new builds.18 I’m assuming 1.5m total heating system replacements p.a. of which 100,000 are heat pumps until 2030, stepping up to 200,000 p.a. until 2035. I assume the government delays the ban on new boiler sales until 2040, so guess at 500,000 sales p.a. from 2035-2040 and then 1.5m p.a. from 2040. This gets me to a c. 50:50 split of the installed base by 2045.
Electricity (29% of gas use) This is a more positive story. Gas made up 32% of our electricity in 2023.19 I assume we need twice as much electricity by 2045, but it becomes just 5% of our electricity mix. This would equate to about a 70% reduction.
I appreciate this is a slightly silly exercise, but if I use my calculations for those four big consumption groups, and then assume 20% reductions in all other uses, I get a 45% reduction in demand for both sets of fossil fuels.

Assuming you want somewhere close to natural gas self-sufficiency in 2045, on my numbers, production needs to remain stable. I’m not a hydrocarbon engineer, but I doubt this is consistent with natural decline rates and infill drilling alone.
I appreciate that there is a switch in my argument here – in that we currently have relatively low carbon natural gas from Norway and I have implicitly argued for 100% self-sufficiency by 2045. I think this is reasonable from a carbon perspective for two reasons.
Firstly, we could do more to reduce production emissions – e.g. measures like rig electrification and reduced flaring. Secondly, more Norwegian gas could go to Europe – which averaged just 15% self-sufficiency across the continent in 2023.20
Oil vs Gas: A Brief Summary

If the UK approves a new gas field, those hydrocarbons will most likely be used domestically. The UK government will also gain counter cyclical tax revenues if gas prices were to spike. A domestically produced BOE of gas is also lower carbon than imported LNG.
If the UK approves a new oil field, the main advantage is the counter cyclical tax revenues associated with an oil price spike.
Feasibility: 3 proposals and their practicality
Make self-sufficiency an explicit aim: Instead of framing the legality of new oil and gas exploration and development with reference to carbon budgets, the UK should set itself the objective of self-sufficiency, especially with respect to natural gas. The UK government should try and model demand 15 years out, based on the installed base of gas boilers and combustion engine vehicles and make these assumptions public. Demand forecasts should be updated on an annual basis as new data on EV and heat pump sales emerges. The government can then base its licensing rounds upon this framework. If demand is running ahead of supply projections, allow more licenses. If supply is running ahead of demand projections, then don’t.
Explore differential tax rates and/or capital allowances for oil vs gas fields: The NSTA already has a list of 476 consented fields back to 1976, all of which are categorised as primarily oil, gas or condensate.21 Oil and gas companies are clearly capable of running their financials on a field-by-field basis. We know this because many fields have multiple investment partners, and the industry has had to deal with differential tax rates for fields consented pre and post March 1993 (due to the PRT) Given the carbon advantages of domestically produced gas over LNG and the likely duration of future gas demand, the UK should consider introducing generous capital allowances for investment into new or existing gas fields to help bolster production.
Consider gas-only or oil-only exploration and development licenses: If the UK had insufficient gas to get close to self-sufficiency, but a surplus of oil (or vice versa) exploration licenses could be granted on a gas field or oil field only basis.
Political and Economic Considerations:
Drawbacks:
Differential tax rates and allowing new licenses would be seen to contradict the Labour 2024 manifesto.
Degree of complexity that might not be justified by the future production prospects of a mature basin
Positives (By category)
Economic Advantages:
Source of tax revenue in a high energy price environment
Improves the energy security of the UK
Improves the UK’s perception with international investors
Supportive for job prospects in a high paying industry
Wider fiscal benefit to the treasury - including pushing out decommissioning spending, which has associated tax deductions
Environmental Advantages:
Gas self-sufficiency is advantageous from a carbon perspective relative to importing LNG
Increased tax revenues would allow greater support for low carbon electricity generation, EV’s and heat pumps
Greater capital for reinvestment would allow UK North Sea operators to invest in electrification and flaring reduction
Might support the integrity of pipeline infrastructure assets which could be beneficial for carbon capture and storage
Political Advantages:
Would show support for an important industry in Scotland
Likely to attract union support- see “No Ban Without a Plan” (Unite)22
Consistent with Rachel Reeves’ idea of ‘Securonomics’
Conclusion:
I appreciate that oil and gas can be a charged discussion topic. I have tried my best to come up with a rational framework that considers the carbon, economic and security implications for the UK. I’m not an oil and gas engineer and I haven’t studied any chemistry since A level. Many of my calculations are back of the envelope. There will be flaws in my argument, so please feel free to point them out in the comments below.
If you think my argument has any validity for the UK, then I would really appreciate you sharing it more widely! The UK needs to have a rational conversation on this topic. I will put together a thread on X / Twitter that summarises the argument and shows the key graphs.
I’m based in London and very happy to share my thoughts and analysis over a coffee.
Appendix: Changes to the original article
The original version of this article (published 10th February 2025) argued that the UK was much closer to self sufficiency in petroleum products than it was for gas production. This was a mistake driven by my ignorance and misreading of the DESNZ data. I displayed a graph like the one below that whilst technically correct, betrayed my ignorance on a couple of points.
It only showed domestic refined product production vs demand - and didn’t consider the additional layer of net imports associated with primary oil
It failed to explain the degree to which domestically produced oil is exported to refineries overseas, and equally the didn’t explain why the UK imports primary oil for its refinery capacity

Apologies for readers who will have received the flawed version in their inbox and thanks again to the individual who pointed out my mistakes.
https://commonslibrary.parliament.uk/research-briefings/sn00341/
https://www.nstauthority.co.uk/regulatory-information/exploration-and-production/taxation/
https://labour.org.uk/wp-content/uploads/2024/06/Labour-Party-manifesto-2024.pdf
https://www.bbc.co.uk/news/articles/c3e1pw7npklo
https://www.bbc.co.uk/news/articles/cxwwzmn12g9o
https://assets.publishing.service.gov.uk/media/66f41bbe3b919067bb4826fc/Diversity_of_supply_for_oil_and_oil_products_in_OECD_countries_in_2023.pdf
https://www.withouthotair.com/c15/page_95.shtml
https://shipsforsale.su/en/catalog/tankers/aframax/
https://www.energy.gov/fecm/articles/lng-basics
https://www.nstauthority.co.uk/media/5tib5x4n/nsta-gas-import-fact-sheet.pdf
https://iea.blob.core.windows.net/assets/743af33c-b2f5-4a93-a925-1b08f6438e61/EmissionsfromOilandGasOperationinNetZeroTransitions.pdf
Page 28 - “Potential Greenhouse Gas Emissions Associated with Shale Gas Extraction and Use” (Department of Energy and Climate Change, September 2013)
DESNZ – Energy Trends December 2024 – UK gas – Table 4.1 – Natural gas supply and consumption.
SMMT data: https://www.smmt.co.uk/2025/01/record-ev-market-share-but-weak-private-demand-frustrates-ambition/
https://www.smmt.co.uk/2025/01/electric-van-demand-static-in-2024-despite-biggest-overall-market-in-three-years/
https://www.uswitch.com/boilers/boiler-statistics
https://www.gov.uk/government/collections/heat-pump-deployment-statistics
https://www.installeronline.co.uk/heating/hpa-data-reveals-2024-a-record-year-for-uk-heat-pump-sales-and-training/
https://www.neso.energy/news/britains-electricity-explained-2023-review
https://assets.publishing.service.gov.uk/media/6762f0b0ff2c870561bde820/Diversity_of_supply_of_natural_gas_in_Europe__2023.pdf
https://www.nstauthority.co.uk/data-and-insights/data/themes/fields/
https://www.unitetheunion.org/campaigns/oil-and-gas-no-ban-without-a-plan
Interesting article and timely, it would be nice to think our political masters will take note.
A few observations for you to chew over ...
The first is on the carbon footprint of Norwegian gas relative to domestic gas, both of which are essentially transported by pipeline from field to consumer. You are right in that the main reason for this is that a substantial number of Norwegian offshore platforms and onshore terminals use electricity as their primary source of power (processing raw gas to remove impurities and then compressing it for export takes a lot of energy). Most UK platforms use gas as fuel in open-cycle gas turbines (lighter, smaller footprint but less efficient than the closed-cycle units used in power stations) to produce the power and heat they need. Most UK onshore terminals use a combination of electricity from the grid and fuel gas for heating and for some of their large compressors. Of course the Norwegians have the advantage of an abundance of cheap, green and reliable ie. non-intermittent hydro-electricity. They also started many years ago, when their facilities were first built; electrification is far easier and cheaper to do from the outset, it becomes very difficult later on to retrofit equipment on a congested, working platform in the North Sea. On a "More or Less: Behind the Statistics" podcast sometime ago I heard someone use this point about relative carbon footprints to argue that we could really just close down UK production and import more Norwegian gas, conveniently ignoring the fact that with the loss of Russian supplies the rest of Europe is trying to do the same because regionally we are a net importer. I think that's the key for me, whether our gas is used in the UK or on the continent via the interconnector, it clearly has a lower carbon footprint than imported LNG and on a regional basis is beneficial. Of course we can't claim it in the official emissions stats. which are territorial but the lunacy of that approach and the perverse incentives it provides could form the basis for a whole other essay.
I have a similar observation for maximising domestic crude production; if we consider the holistic or even regional impact rather than just the territorial emissions when assessing environmental benefits (after all CO2 doesn't recognise international boundaries so why should we) the case becomes clear. Rather than repeat the argument, just follow this link to a comment I made on the Ed Conway, Material World post you refer to:
https://open.substack.com/pub/edconway/p/why-does-britain-export-80-of-its?r=56zdk4&utm_campaign=comment-list-share-cta&utm_medium=web&comments=true&commentId=108154931
In terms of differentiating the tax take or indeed consents between oil and gas fields I think we need to remember that all oil fields produce some gas and all our gas fields contain Natural Gas Liquids (LPG and light oil/condensate). Rosebank for example will be exporting some pipeline gas and Jackdaw some liquid hydrocarbons.
Finally, your comment/recommendation about electrification and flaring. If you look at the OEUK stats. you'll see that certainly with flaring and so called fugitive emissions this is something the industry continues to make real strides on. It is more difficult for electrification projects for the reasons I've outlined but they are being seriously considered and where a case can be made I'm sure operators will implement them. What doesn't help of course is that environmental projects are rarely value adding in economic terms and trying to make the case for investment in assets now running on very tight margins, or that are in many cases loss-making due to the excessive tax take, is well-nigh impossible.
Oh, not quite finally. Another advantage to the UK Treasury other than the revenue of course is that postponing field abandonment delays the government having to stump up tax reliefs for decommissioning expenditure. Everyone knows oil and gas offshore projects are expensive to install, well removal uses essentially the same high-spec. drilling rigs, heavy-lift vessels etc. and isn't cheap.
If you ever fancy that coffee let me know ...
https://www.linkedin.com/in/mark-hazell-8bb80424?lipi=urn%3Ali%3Apage%3Ad_flagship3_profile_view_base_contact_details%3B65rZo%2FdLSzqbNA3LxEgffg%3D%3D
Where going to need gas for quite a while longer so we should have exploited what we had in the N.Sea thats what i call energy security.