
The Missing Chart from the UK Energy Debate

I am trying to analyse energy in the UK to help improve policy. None of the content should be construed as investment advice. I have done my best to ensure that the content below is accurate – but I am human and will make mistakes – if you spot any, please let me know and I shall update as appropriate.
I have noticed a trend of late – televised debates and newspaper articles are starting to gain a degree of affinity with electricity prices. There are two key soundbites:
1. “UK wholesale electricity prices are set by gas 98% of the time”
2. “Wholesale prices are only 40% of the electricity bill”
Whilst I might not be summarising the two arguments entirely accurately, I have noted a tribal split - those who don’t like fossil fuels tend to pick the first argument, and those who don’t like renewables opt for the latter!
I want to throw in a chart to add to the newfound interest in UK electricity price formation. It is my attempt to disentangle the marginal gas and carbon costs for a 50% thermally efficient combined cycle gas power station from January 2012 to March 2025. My thanks to Ember Energy as one of their charts gave me the idea.
The Chart
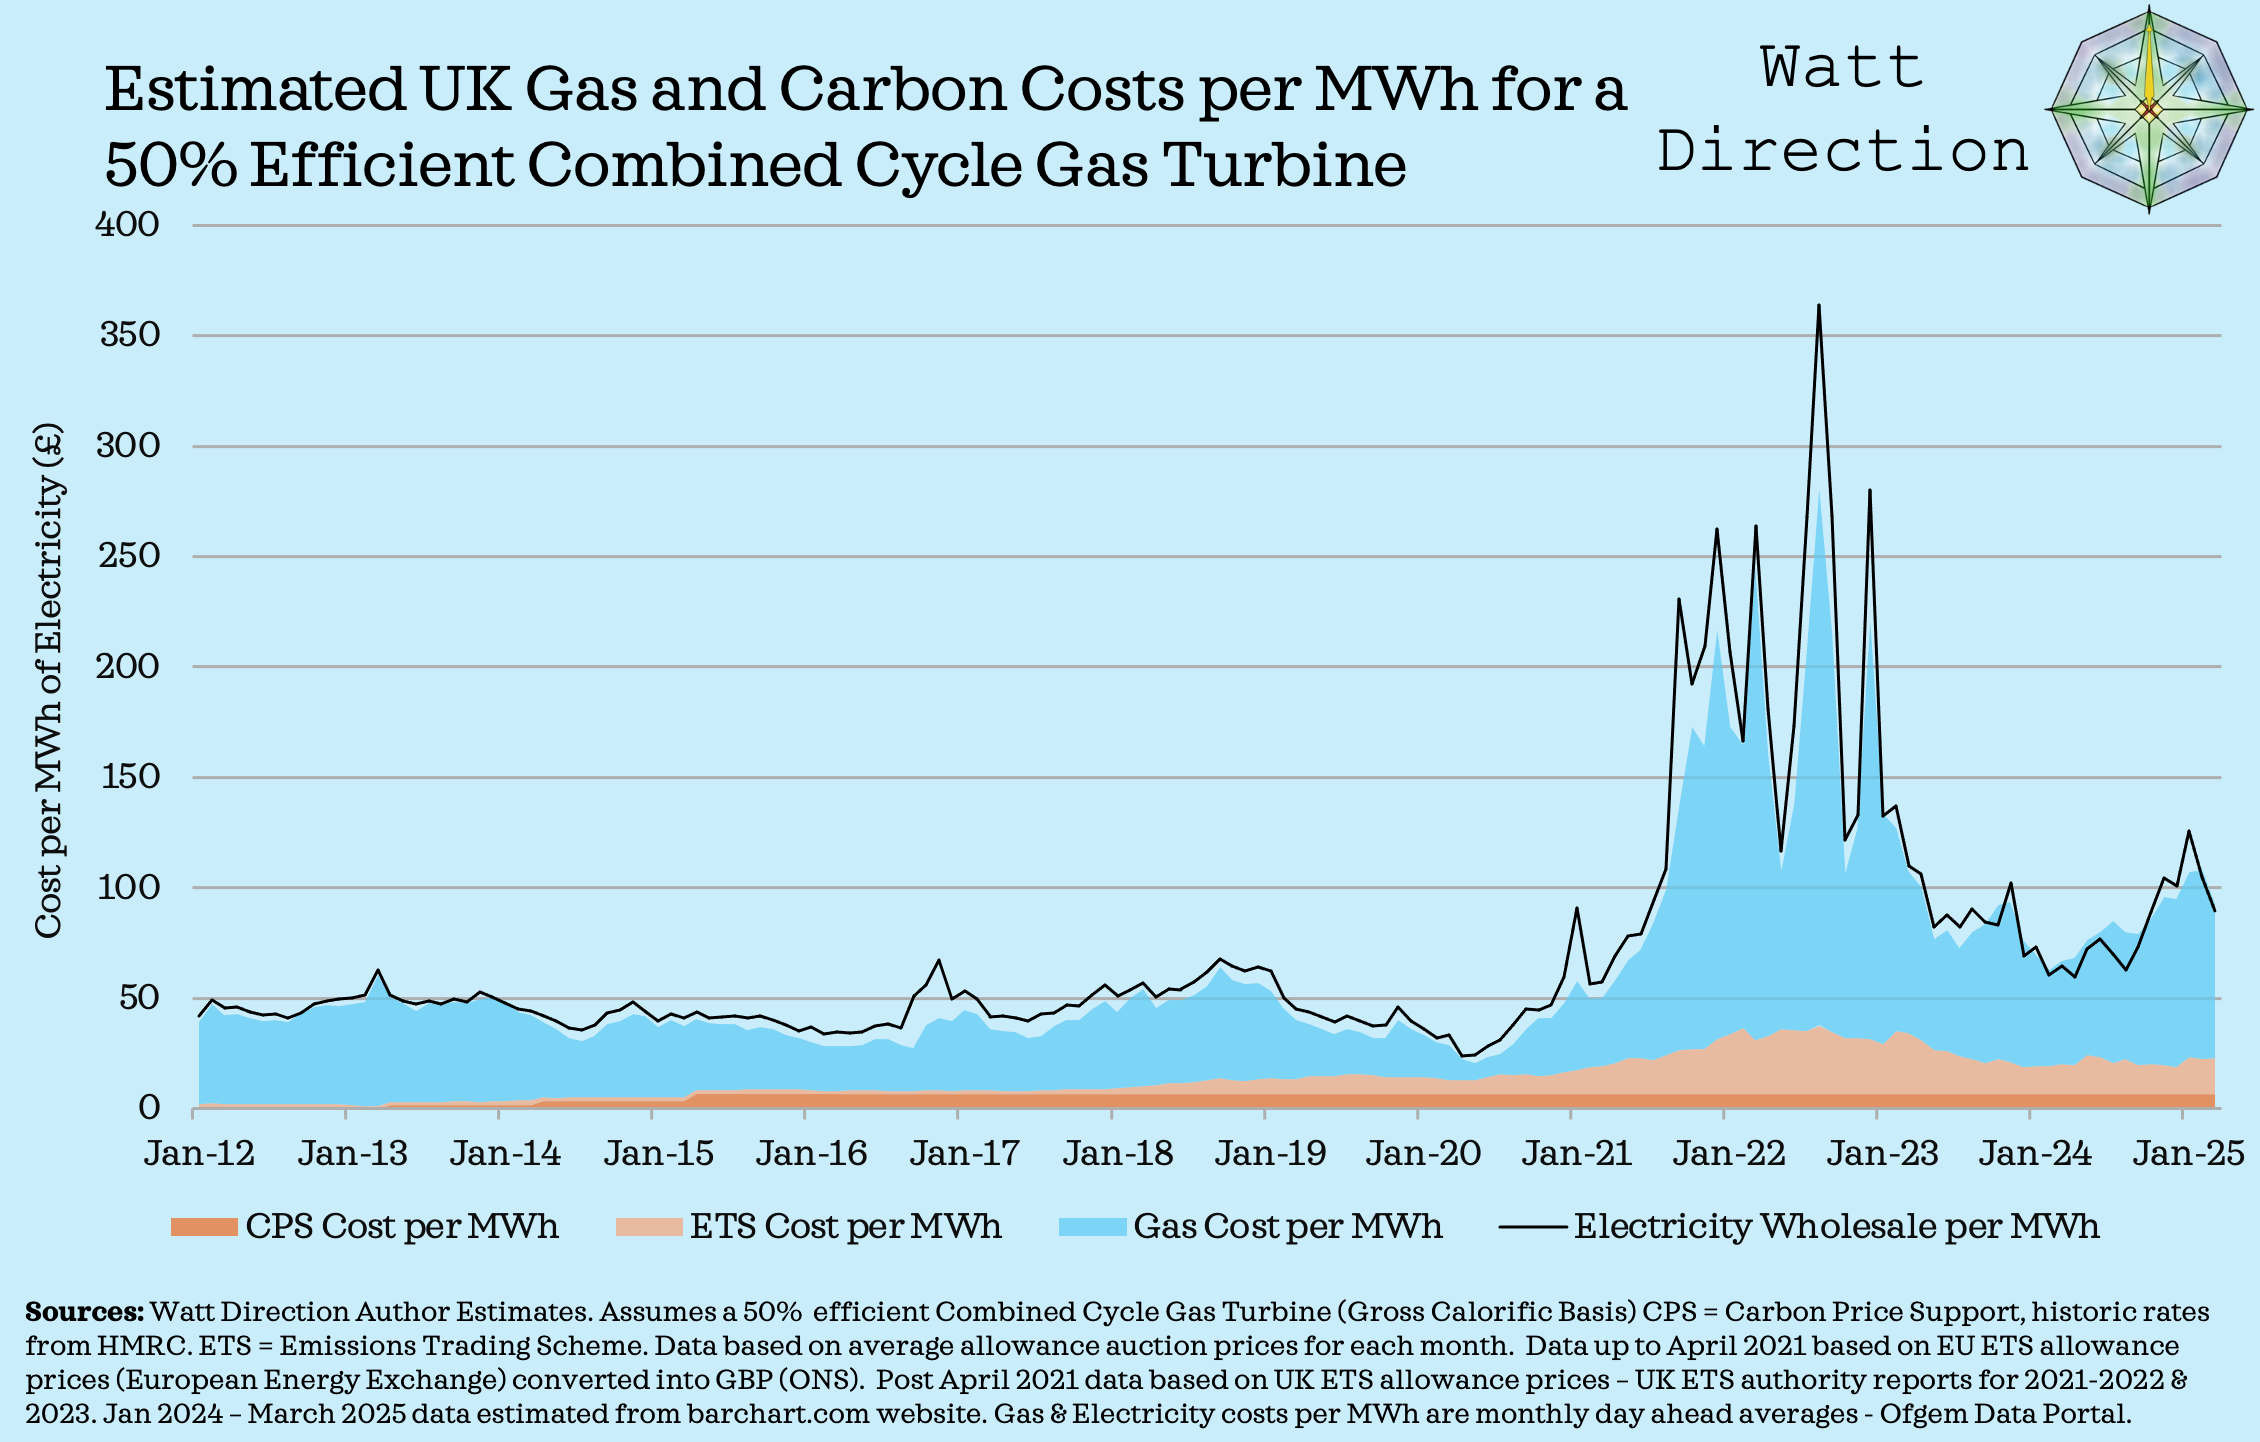
I appreciate there is a lot going on here – so a brief explainer:
Carbon taxes x 2 - In orange shading:
CPS or Carbon Price Support - dark orange – a flat tax per tonne of carbon. First introduced in April 2013 at £4.94 per tonne, has been held at £18 per tonne since April 2016.
ETS or Emissions Trading Scheme(s) - light orange – a tax where electricity generators must buy an emissions allowance for each tonne of carbon they emit. These can be purchased at auction, or in the secondary market and the price fluctuates. UK generators used to be part of the EU ETS until 2021, when the UK ETS came into being.
Gas costs - blue shading
Wholesale electricity price - black line
I am going to use this chart to make four observations.
(1) Carbon costs also set the wholesale price:
The marginal cost of electricity generated by a gas power station is not just a function of the gas price – the price of carbon also matters. This is important, because gas power stations set the wholesale power price the vast majority of the time in the UK.
These carbon prices are a policy choice that increase the cost of electricity to consumers. I think they were rational whilst coal was still on the grid, but they need to be re-examined given the demise of coal in the UK from the 1st of October 2024.
(2) Carbon costs fly under the radar:
I previously wrote a post that broke down the cost components in a typical household electricity bill from 2014 – 2023. These extra carbon costs will likely sit within my “direct fuel costs” category and I suspect their impact is missed by most analyses, including my own. Arguably they should be categorised as a separate policy cost.

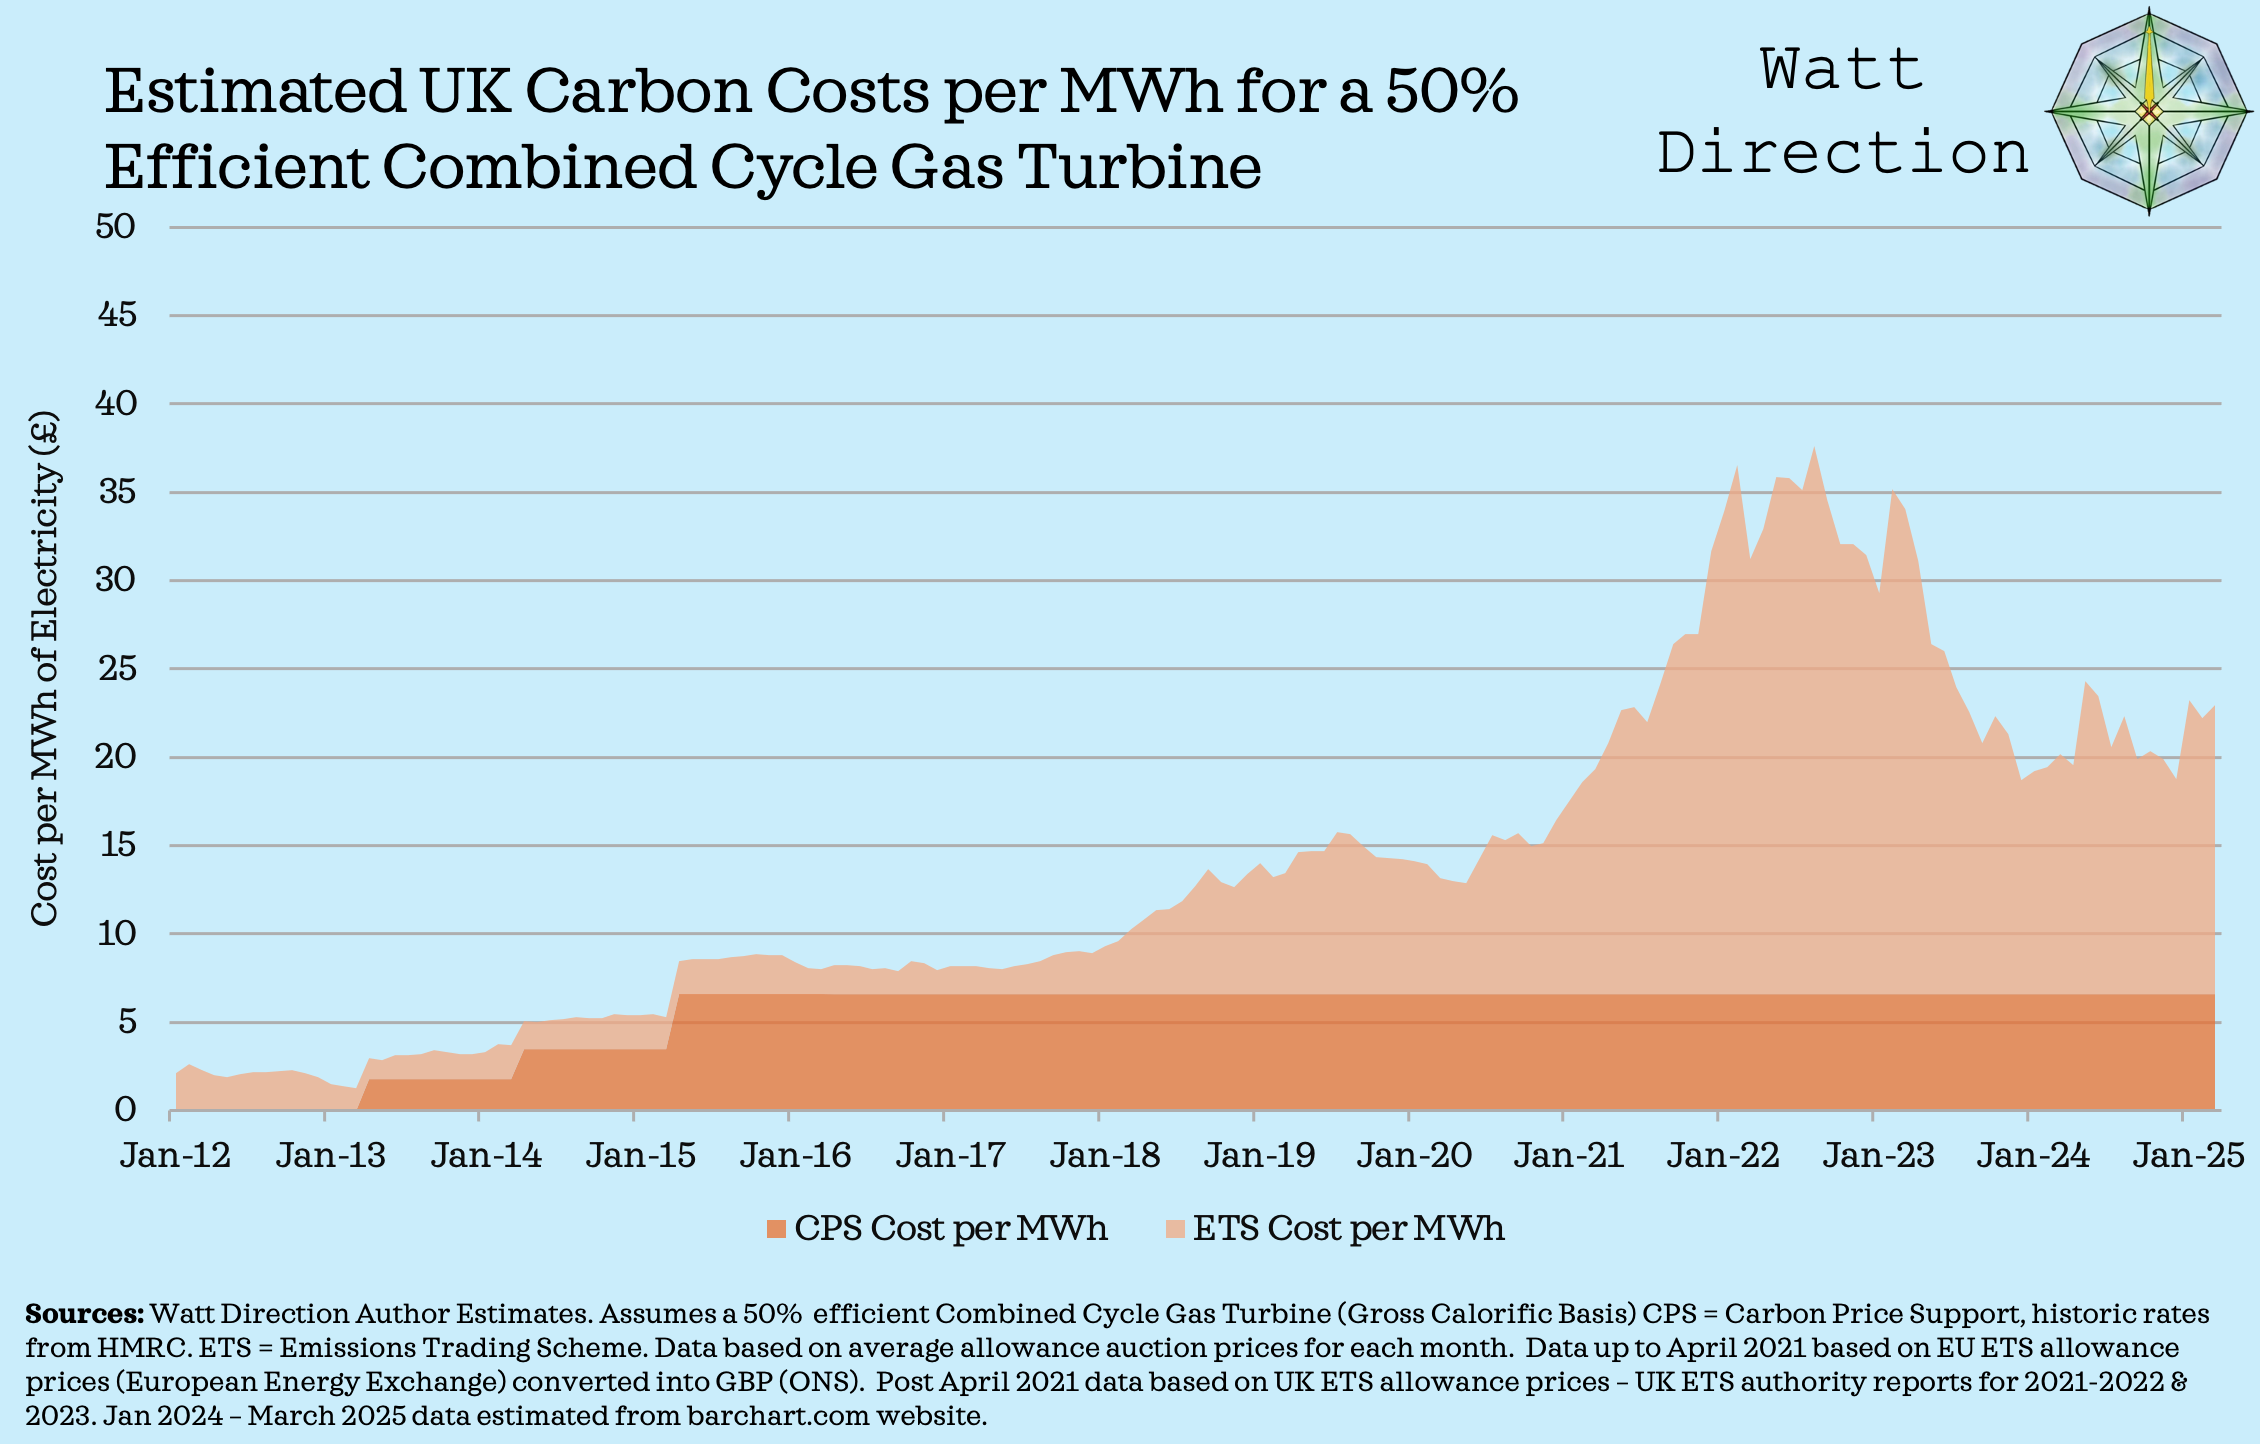
(3) Carbon costs spiked during the energy crisis:
I am not for a moment suggesting that carbon costs were the main driver of the electricity price spikes from 2021-2023 – the rise in the gas price was much more important.
However, carbon costs did also rise quite appreciably – and I have seen relatively little comment on this. I have broken out the changes to carbon costs by themselves, as they get slightly lost when compared with the scale of the gas price moves.
(4) Carbon taxes were effective in helping drive coal off the UK grid
This will take a couple of graphs. Firstly, I have included a zoomed in version of the original graph. I have also added two coloured ovals.
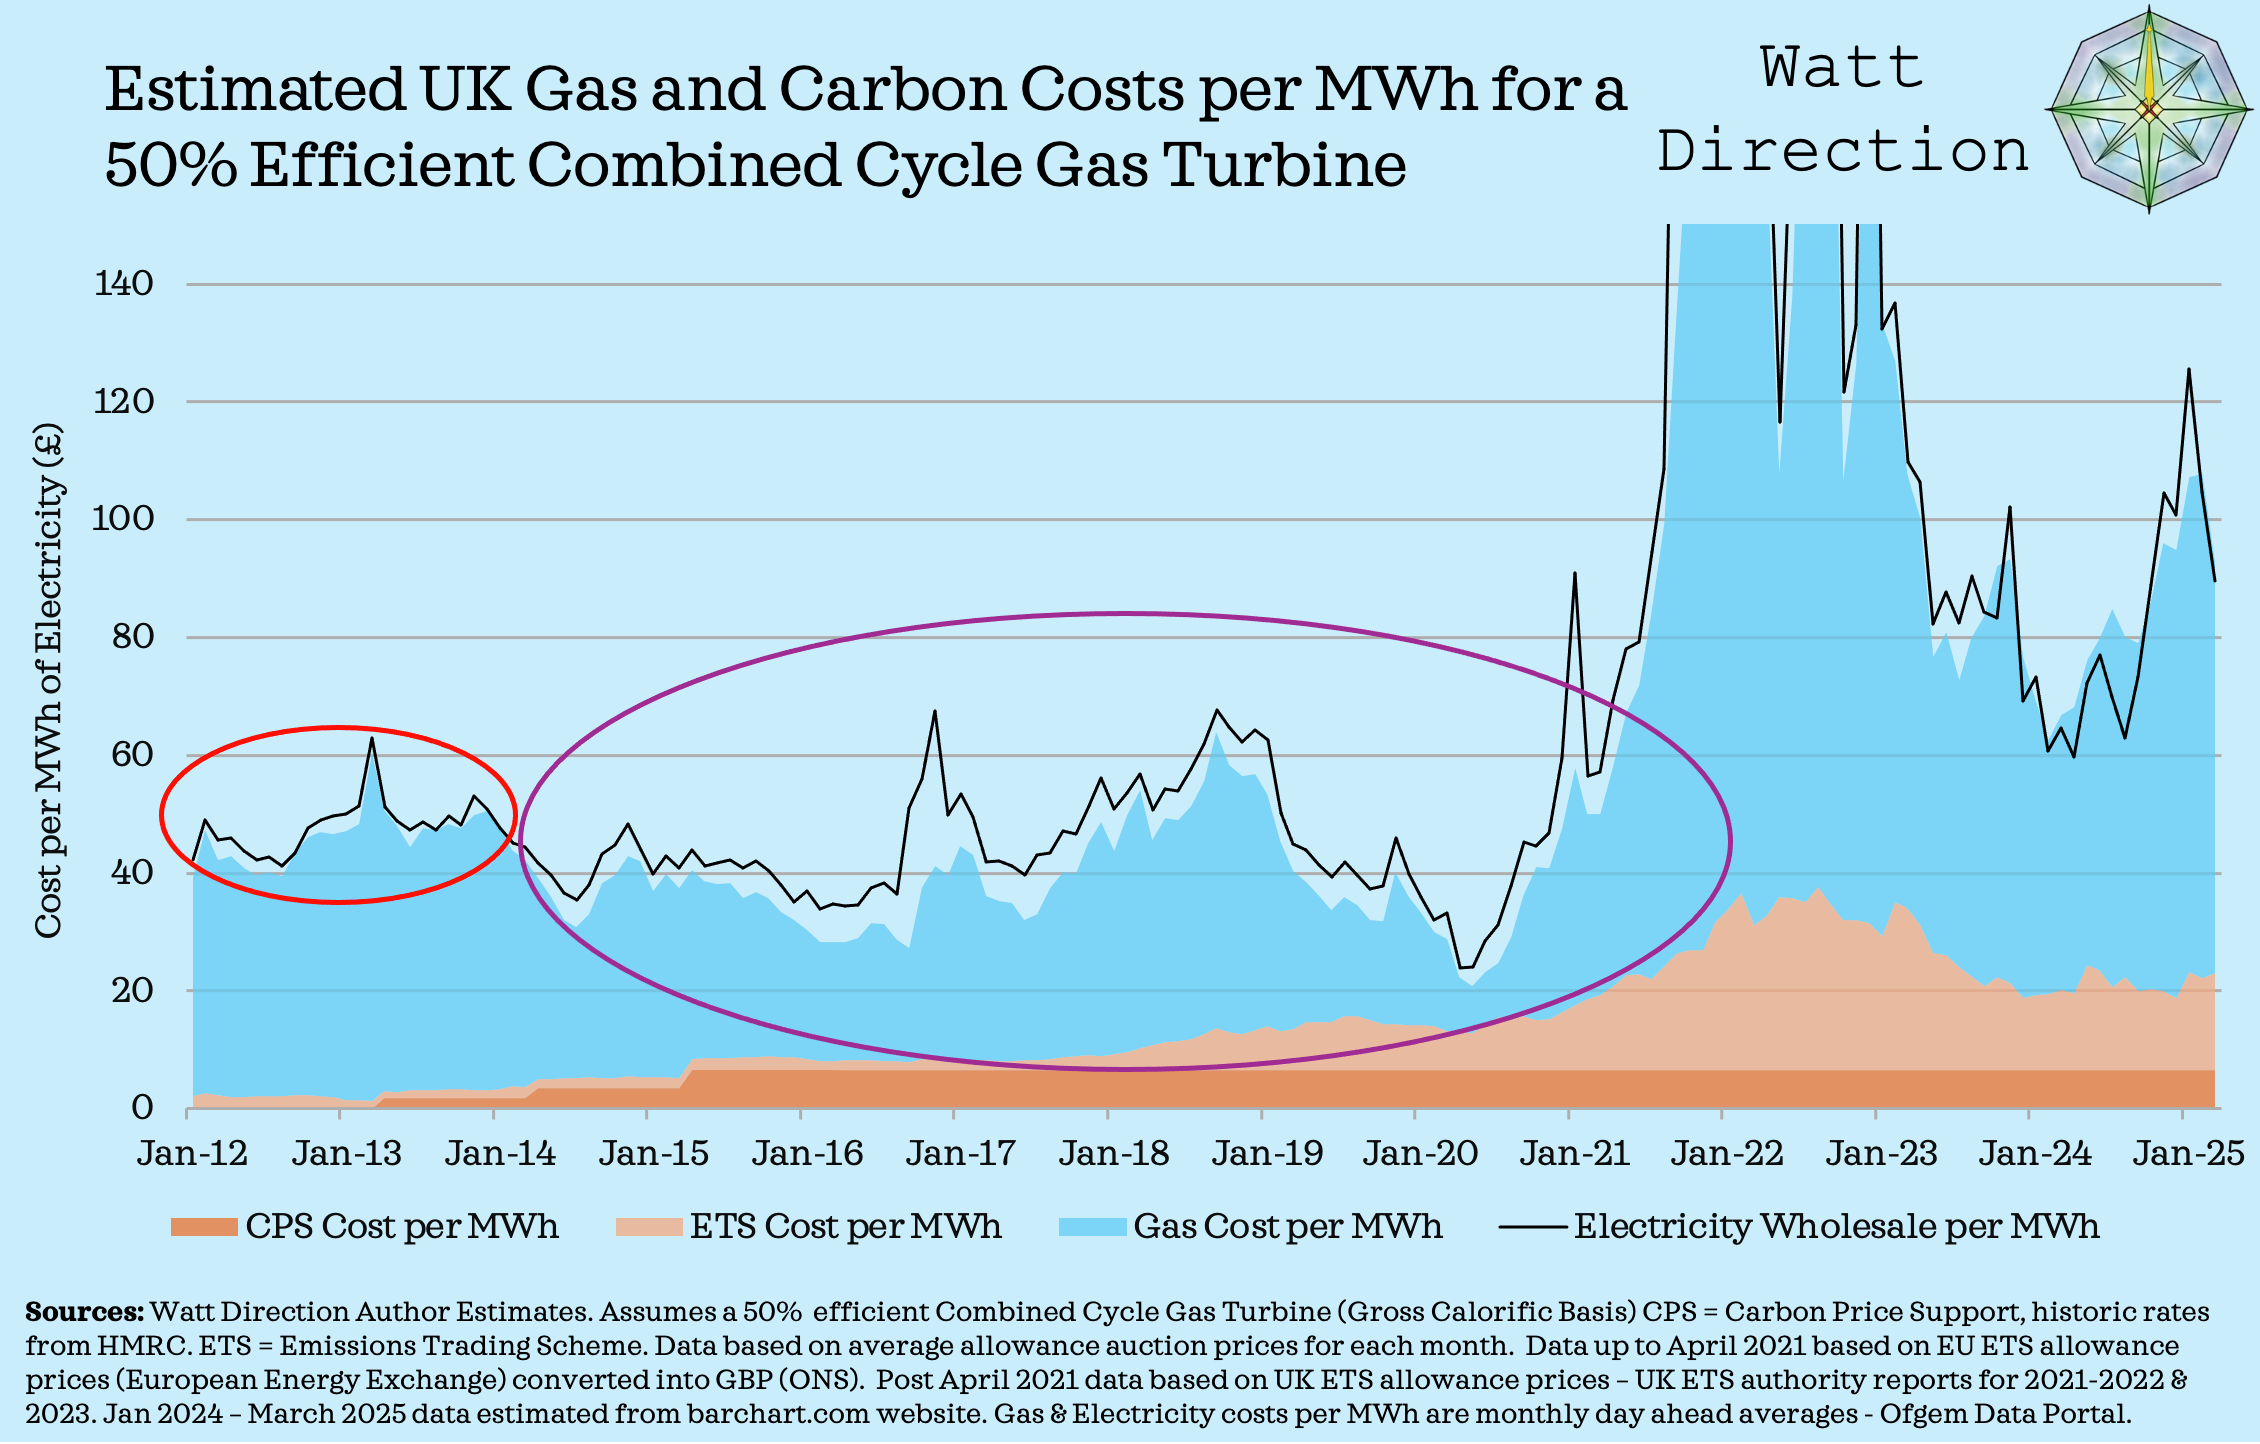
Notice that in the small red oval, the combined carbon costs and gas costs are very close to the wholesale electricity price. This suggests that a 50% efficient combined cycle gas power station would be making almost zero short run profit and is likely to have been the marginal price setting technology in the wholesale market.
In the purple, you can start to see a gap emerging – i.e. the electricity wholesale price is now some way above the gas & carbon costs for a combined cycle gas power station. Crudely, the combined cycle gas turbine (CCGT) is now profitable in the short run, and some other technology is acting as the most expensive marginal generator.
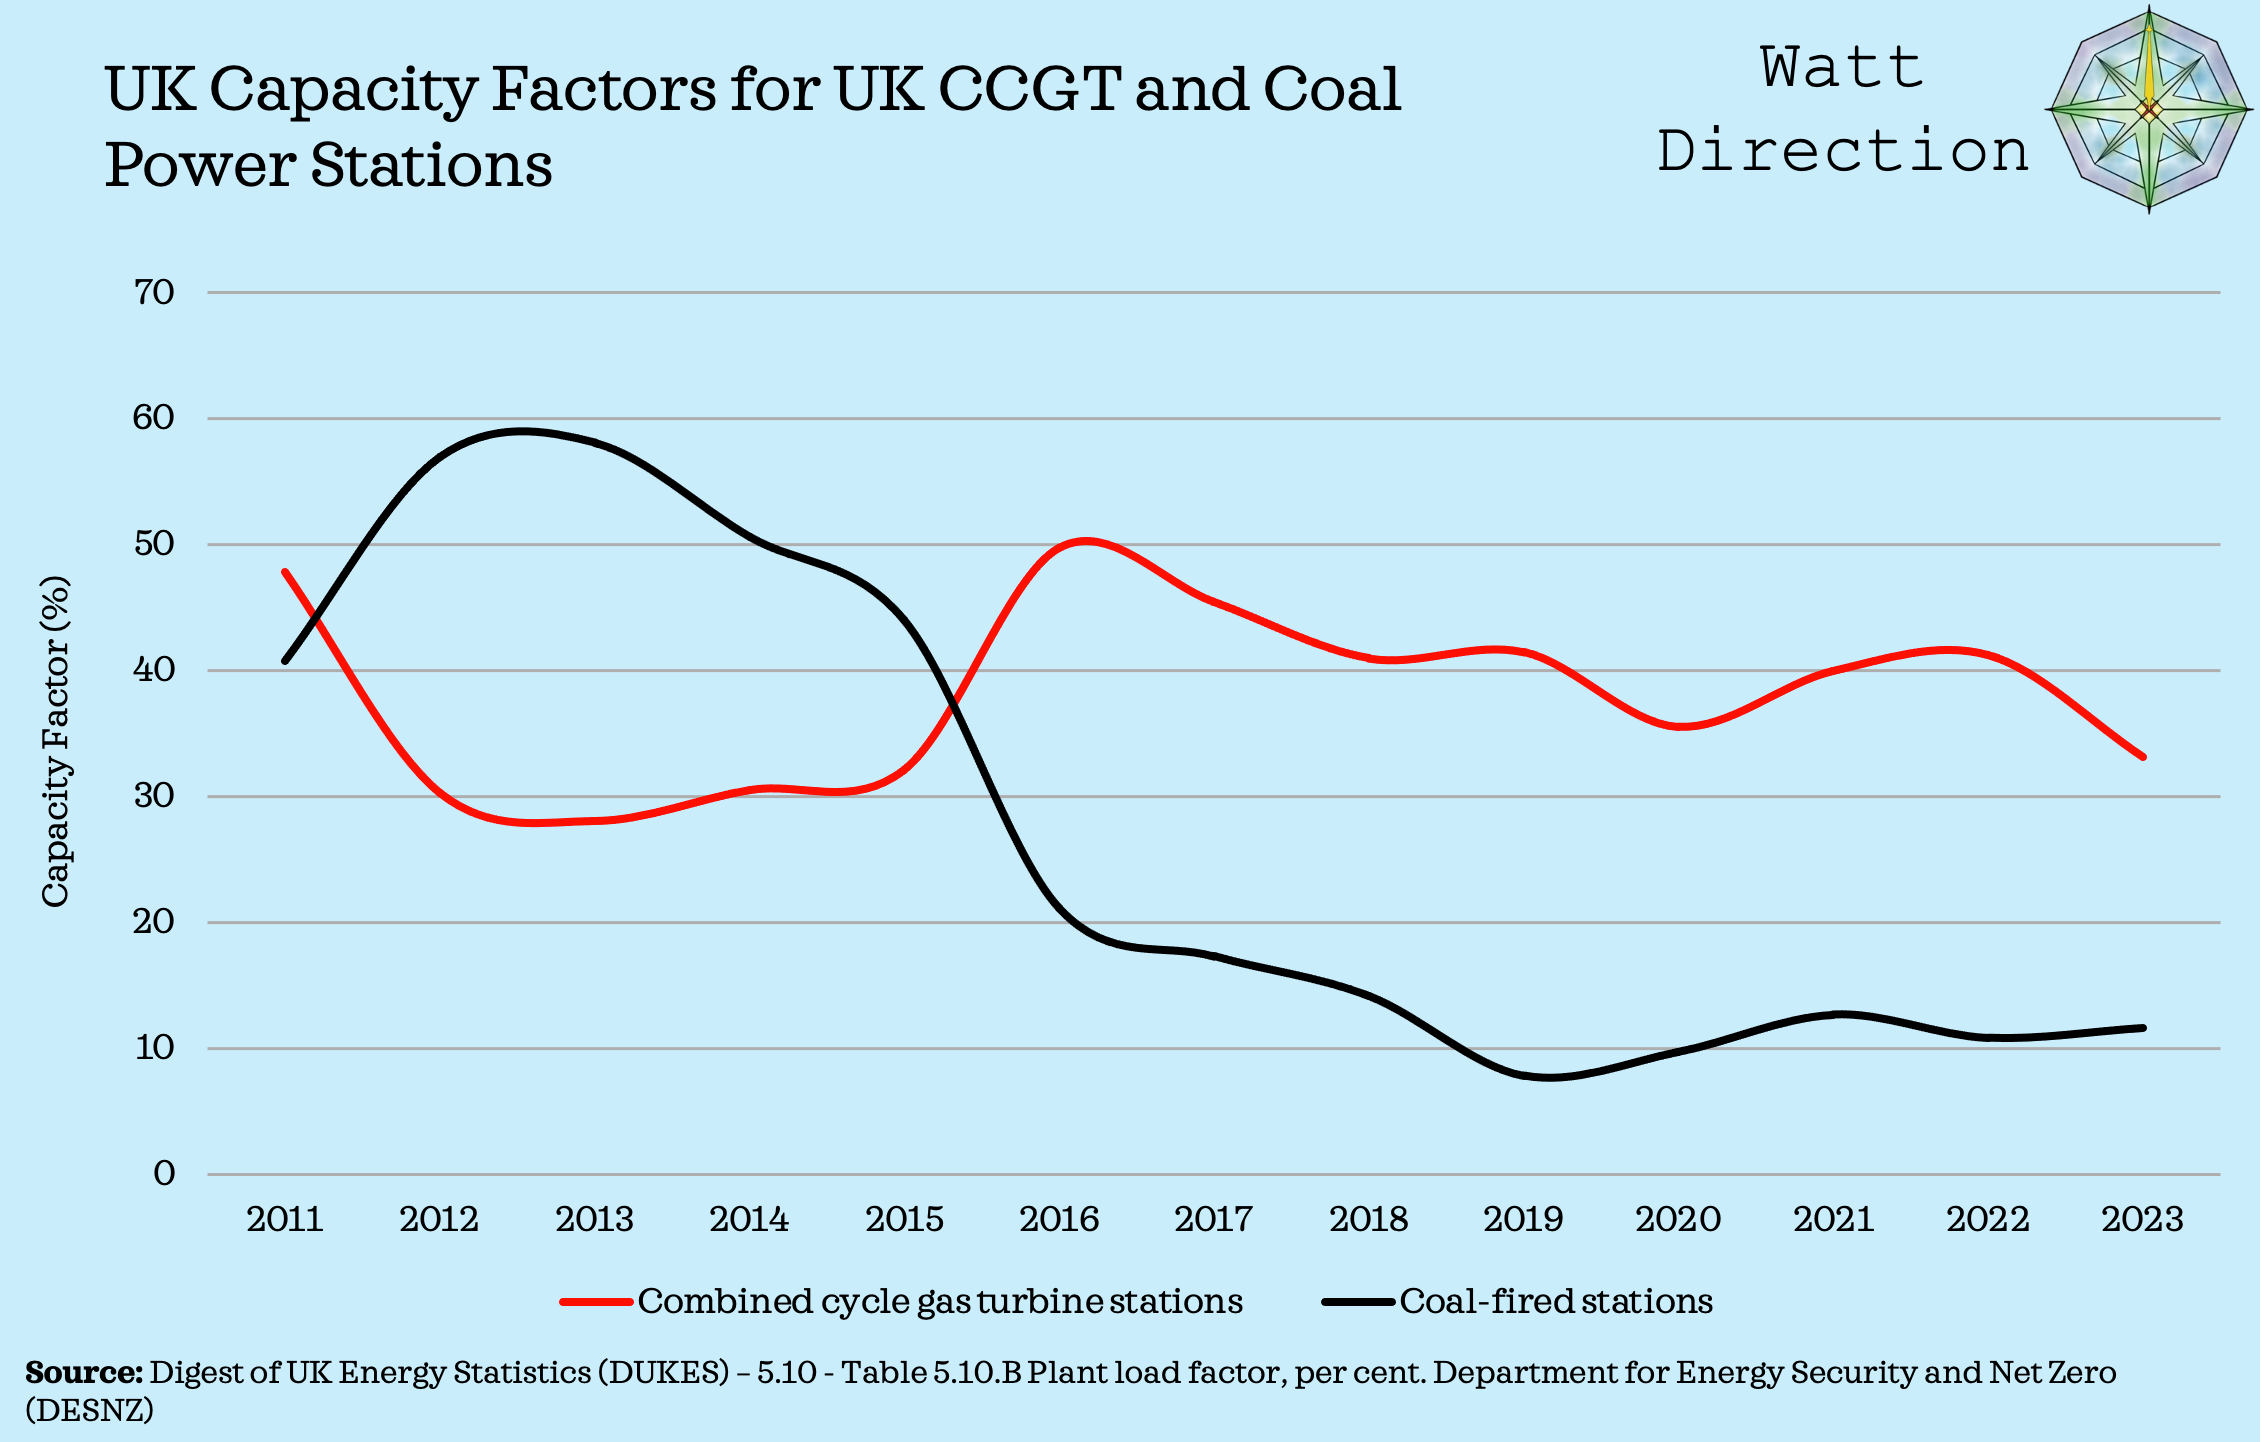
The Capacity Factor data from the Department for Energy Security and Net Zero suggests that increasing carbon prices helped improve the economics of gas relative to coal fired power stations during this time period. Notice that CCGT capacity factors were under serious pressure from 2012-2014, especially relative to coal.
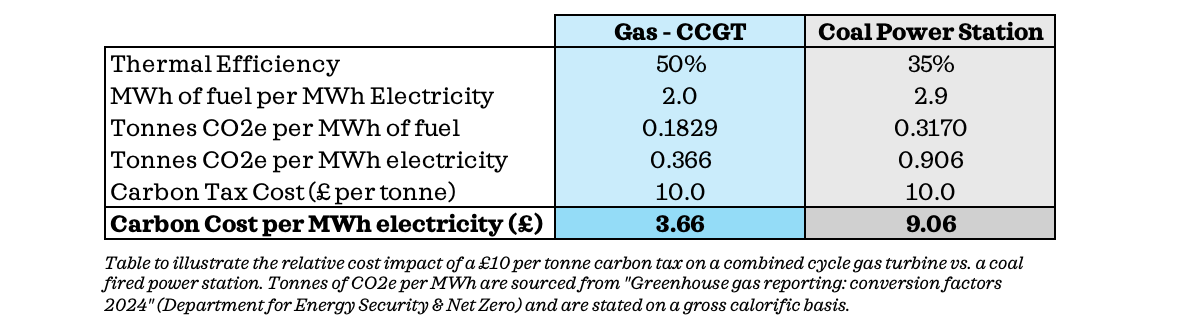
I have made a table to show the impact of a £10 per tonne carbon tax for a gas and coal power station. On my maths, the introduction of an illustrative £10 per tonne carbon tax would give a CCGT a c. £5.40 per MWh relative cost advantage compared to a coal fired power station.
Carbon taxes on electricity generators – should the UK reconsider?
Finally, I want to make a brief argument in favour of reducing, restructuring or removing these carbon taxes since the UK grid went coal free from the 1st of October 2024.
I will probably elaborate on this in a later post, but I wanted to present the argument to gather some feedback about the idea. The key advantage from my perspective, is that reducing or removing carbon taxes would reduce the cost of electricity, which in turn should incentivise the adoption of electrification technologies such as heat pumps and EV’s, which are a crucial part of any long-term decarbonisation plan.
The chart below illustrates how this could work – gas would remain the highest marginal cost technology due to its fuel cost, but the wholesale clearing price would be lowered across the rest of the generation stack, saving money for businesses and consumers.
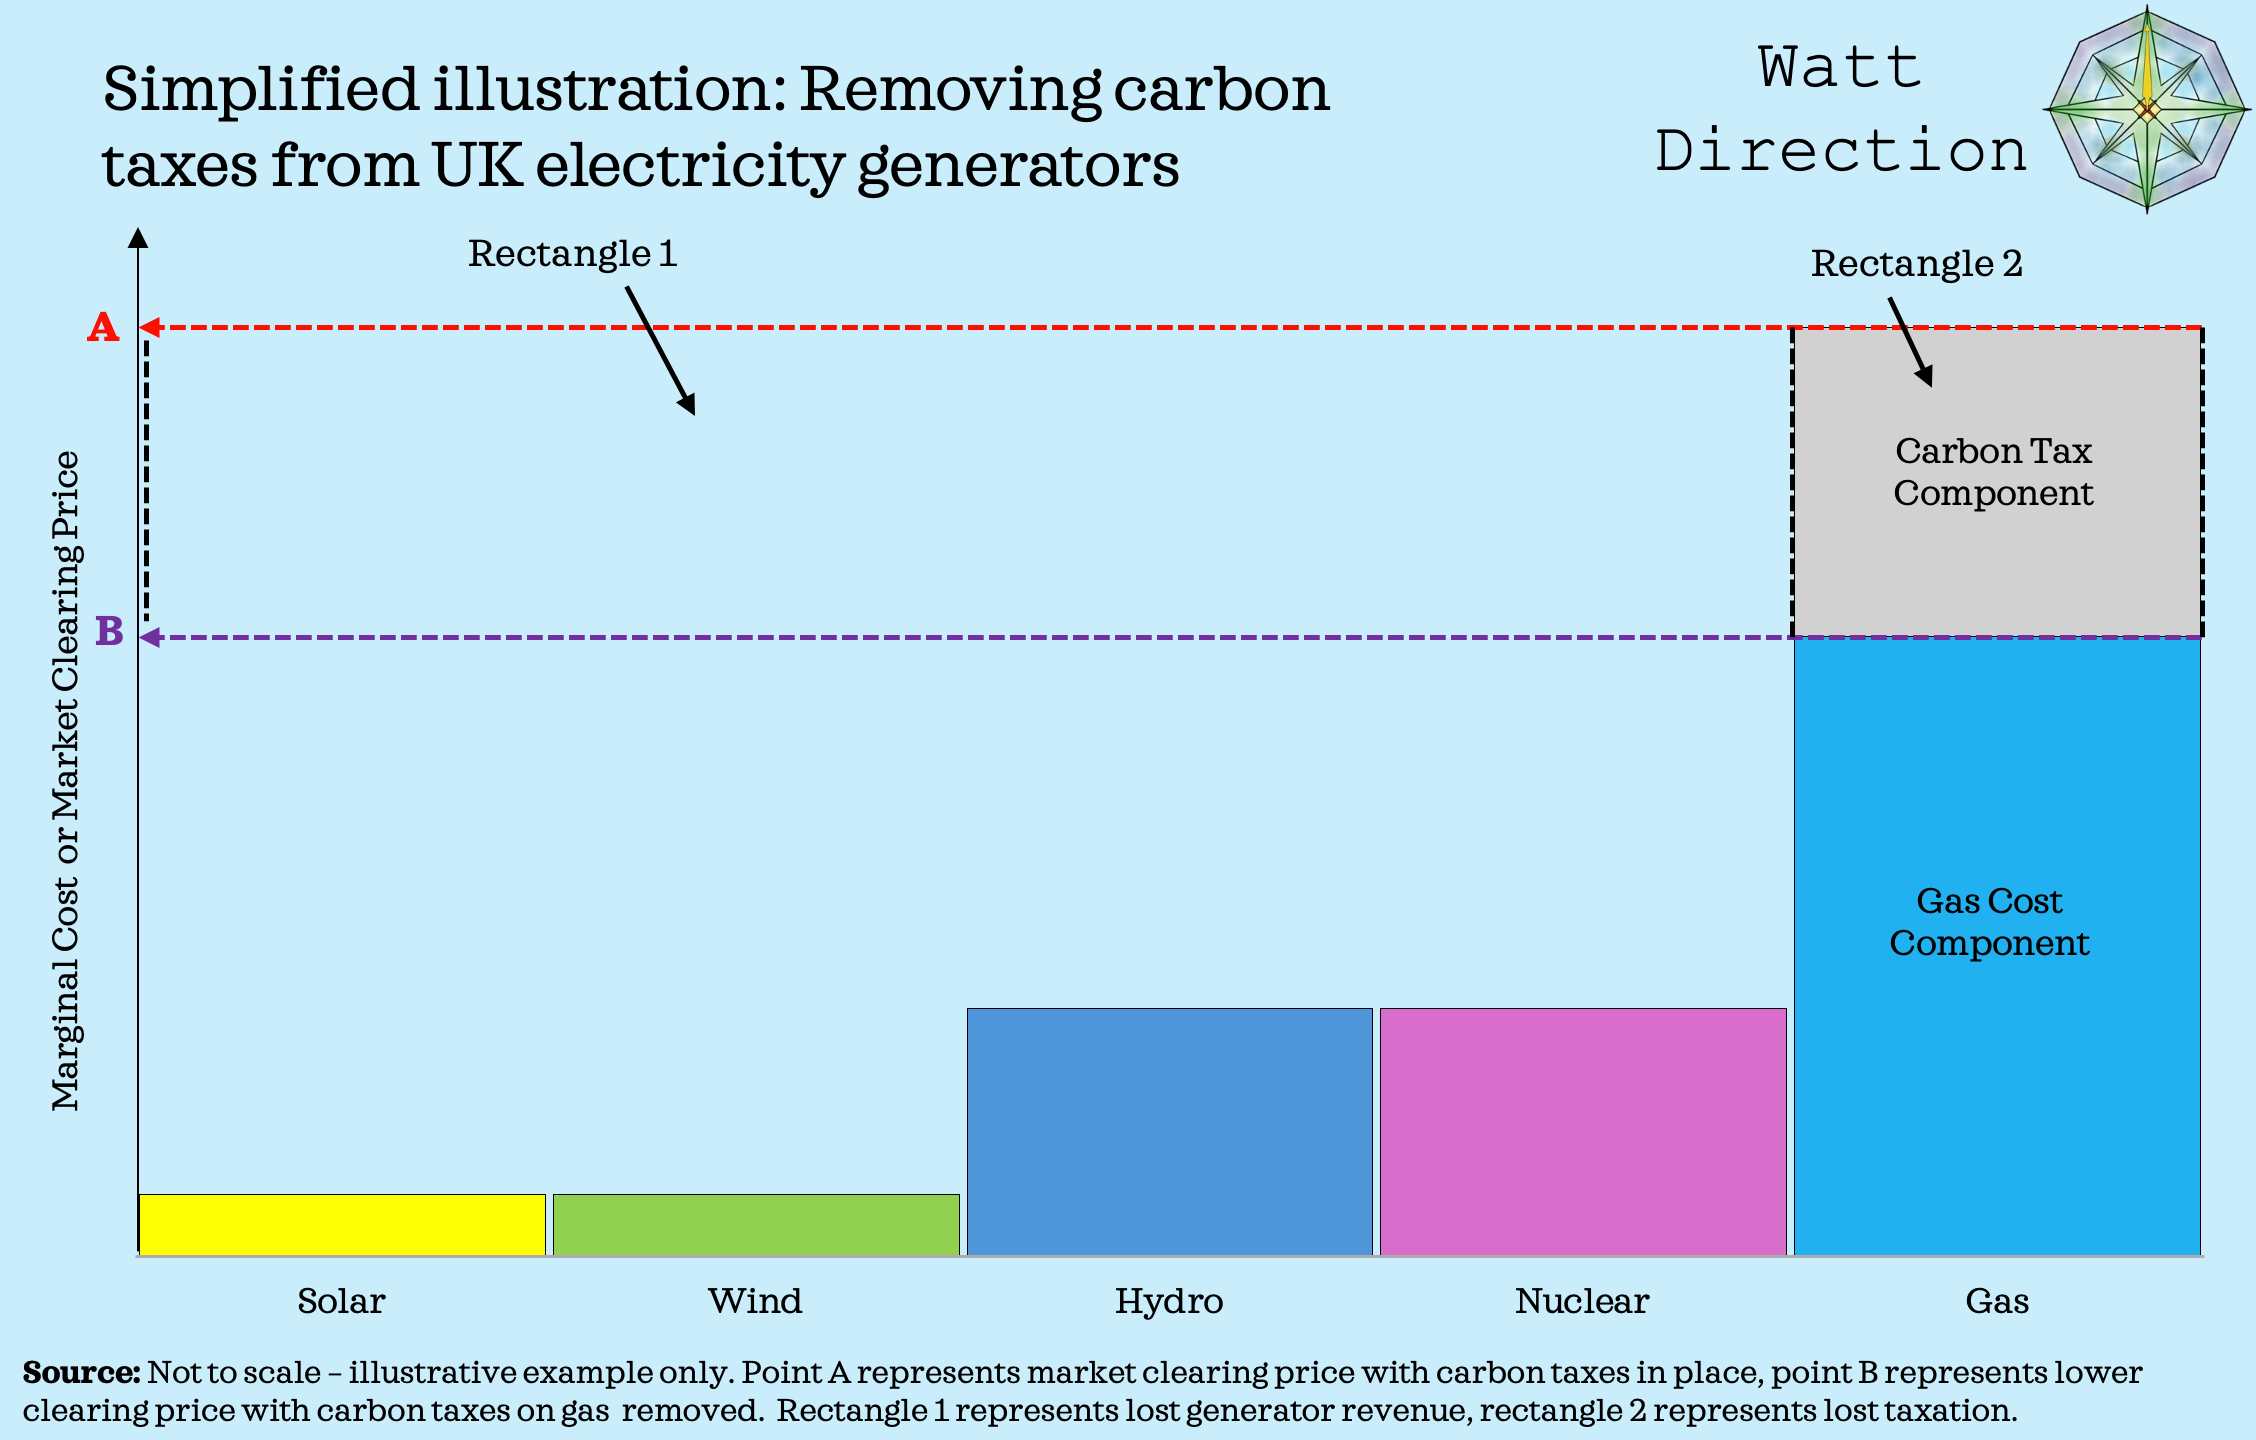
I have added two rectangles to the chart to illustrate the winners and losers from such a change. Rectangle 1 represents lost revenue for solar, wind, hydro and nuclear generators. Rectangle 2 represents the tax revenue lost by the government. The combined area of Rectangles 1 and 2 represent the combined savings for consumers of electricity.
The illustration isn’t quite right because CFD based generators wouldn’t be impacted by this change. Note that gas remains the highest marginal cost technology – this is crucially important, as it means that you shouldn’t suddenly get gas power stations taking significant market share as a result of the change.
Disadvantages:
A government with limited fiscal headroom will lose some tax revenue
Smaller intraday electricity price differentials will make investment in storage projects less attractive
Non-ROC and non-CFD supported low carbon technologies might need some financial support (e.g. existing hydro and nuclear)
Generation economics will be less attractive for CFD projects once the CFD has expired - likely driving more expensive up-front bids
Stop taxing electricity if you want electrification…
Whilst there are drawbacks to this plan, I’m increasingly sensing a major policy opportunity that could help unlock a positive feedback loop of electrification, decarbonisation and economic growth. It will require a proper essay to explain, but it looks something like the below:
Change policy to cut the cost of electricity in both absolute terms and relative to gas/petrol/diesel
UK electricity use finally starts to rise as electrification technologies are adopted
Rising electricity use helps reduce unit costs as fixed costs in the system are amortised over more volume
EV adoption provides a degree of demand flexibility to the system, reducing costs
I think this is a much more pragmatic decarbonisation vision for the UK – and crucially uses a lot more carrot and a lot less stick. Feel free to mention any drawbacks to this plan that I haven’t anticipated in the comments below.
Appendix:
Building the chart was reasonably simple, but there are a couple of things to explain. Firstly, I am assuming a 50% thermally efficient combined cycle gas turbine on a gross calorific basis. 50% is pretty close to the 49.9% assumption in table 5.10.C for UK CCGT’s in 2023.1
My chart is trying to calculate the gas and carbon cost components for 1 MWh of electricity, so 50% efficiency means I need 2 MWh’s of gas as an input.
The gas price I used is sourced from OFGEM and is a monthly average of day ahead prices. It is quoted in pence per therm, and there are c. 34.12 therms per MWh, so it was just a case of taking the quoted price in pence per therm, multiplying it by 2, then multiplying it by 34.12 to express it in pence per MWh before dividing by 100 to get it in £ per MWh.
The Carbon Price Support was relatively easy, as historic rates were available from an Environmental Tax Bulletin from HMRC.2 I knew I needed to calculate the costs for 2 MWh’s of gas per 1 MWh of electricity. I used the carbon intensity figure of 0.1829 kg of CO2e per KWh for natural gas (gross caloric) from the DESNZ 2024 Greenhouse gas reporting conversion factors.3 This meant I needed 2 x 0.1829 or 0.3658 tonnes of CO2e for each MWh of electricity for both the Carbon Price Support and the Emissions Trading Scheme.
The Emissions Trading Scheme costs were the most difficult bit – I used EU allowance prices up to and including April 2021, sourced from the European Energy Exchange Website.4 To make it monthly data, I just did a simple average of every auction price for each month. I converted the figures from euros into pounds using monthly exchange rate figures from the ONS.5
From May 2021, I switched to using UK ETS auction data. Whilst this meant no FX conversion to worry about, it wasn’t easy to get hold of auction price data – figures for 2021, 2022 and 2023 were retrospectively published in two reports from the UK ETS authority.6 Again I calculated a simple average of the auctions occurring in each month.
For 2024/2025, I used the barcart.com website which had a monthly price chart for December 2024/25 UK allowance futures. I couldn’t find a data table, so I was reduced to lining up my cursor with monthly data point and estimating a value.7
Digest of UK Energy Statistics (DUKES): electricity - Plant loads, demand and efficiency (DUKES 5.10) - Table 5.10.C
HMRC: Environmental Taxes Bulletin historical rates: Updated 28 June 2024
Department for Energy Security and Net Zero - Greenhouse gas reporting: conversion factors 2024. Condensed Set - Fuels tab
Office for National Statistics: Average Sterling exchange rate: Euro XUMAERS
Report on the Functioning of the UK Carbon Market for 2021 and 2022 A joint report from the UK ETS Authority and Report on the Functioning of the UK Carbon Market for 2023 A joint report from the UK ETS Authority
The disadvantages of reducing/removing carbon taxes sum things up! The Government's tax revenue will decline (leading to spending cuts or increased taxes elsewhere) and the energy transition will slow. I certainly don't regard these things as advantages! The only significant advantage I can see of reducing carbon taxes is a temporary, small reduction of electricity prices. However, this advantage will decrease with time as gas use decreases anyway. BTW wholesale prices are more like 45% of the total electricity price at the moment if you exclude VAT - the size of VAT is dependent on the sizes of the elements that make up the bill. See my Figure 2 in my post at https://davidtoke.substack.com/p/how-cheaper-batteries-and-renewables
If the government is serious about lowering energy prices it would abolish Renewables Obligations (RO) immediately. For a typical household bill of £912.62 [1] ROs add 11.4% or £104 (for a QRD [2] or Legislation [3]).
The RO scheme requires electricity suppliers to source a certain portion of their supply from renewable generation. In practice, this means suppliers must obtain a set number of Renewables Obligation Certificates (ROCs) for each unit of electricity they sell, if not they face penalties.
There are 2 mechanisms by which the Renewables Obligation Order 2015 [3] determines the supply of ROs, and in typical Whitehall fashion this involves creating an illusion of scientific rigour through a convoluted calculation, in which multiple constants multiply varying values, transparently devised to yield a predetermined outcome without any empirical justification. And of course the highest calculation is chosen (another brilliant Whitehall scheme to marketise out equations for highest output).
Currently, the obligation level for suppliers in England and Wales for 2024–2025 is set at 0.490 ROCs per megawatt-hour. To remove this horrendous cost and reduce bills, the Secretary of State for the Department for Energy Security and Net Zero could immediately exercise statutory powers under the Electricity Act 1989 to amend the Renewables Obligation Order 2015, explicitly setting the RO level to zero (yes zero) through a straightforward statutory instrument.
Is this legal? Yes, absolutely. But what about renewable generators' returns? Let me state that the fundamental purpose of an energy system is to reliably and affordably provide energy to end users, not to endlessly sustain inflated profits within the energy sector. High energy costs benefit the energy industry but they impose broader harm on the overall economy. Anyone prioritising returns for renewable producers effectively prioritises higher energy costs, placing the health of the wider economy in jeopardy (see the destruction of the chemicals industry, steelmaking, ceramics, I despair to go on...). If we truly value economic prosperity, we should celebrate reduced margins in the energy sector, so that the energy system serves the economy rather than dominating it.
[1] https://www.electricitybills.uk/
[2] https://en.wikipedia.org/wiki/Renewables_Obligation_(United_Kingdom)
[3] https://www.legislation.gov.uk/ukdsi/2015/9780111138359/pdfs/ukdsi_9780111138359_en.pdf